
England Population


Factsheet: England Population
Key Takeaways
- The population of England is growing and ageing rapidly. The South West has by far the oldest population, London the youngest.
- The total fertility rate varies widely across local authority districts and is not high enough to replace the population. Similarly, age-standardised mortality rates and life expectancy varies widely across England.
- In 2021 net migration stood at nearly 500,000. London has the highest share of foreign-born residents, the North East the lowest. London is losing population to other regions in England.
The population of England is growing and ageing
In mid-2021 the resident population in England was 56.5m, up from 53.1m in mid-2011 (+6.6%). There were marginally more women than men (51% vs 49%), while the median age was 40.5 years, up from 39.4 years a decade earlier.

Between mid-2011 and mid-2022 the number of people aged 0 to 19 years increased by 2.6%, that of people aged 20 to 64 years (commonly defined as ‘the working age’) by 4.3% and that of people aged 65 years and over by 19.9%. As a result, for every person aged 65 years and over there were around three people of working age – down from nearly four people in mid-2011. This is referred to as the old-age dependency ratio.
London and the South West stand out among English regions in terms of age structure
The age structure among English regions varies considerably. In terms of the old-age dependency ratio, the South West has by far the oldest population of all the English regions, with only 2½ people of working age for every person aged 65 years and over, followed by the North East at 2¾. At the other end of the spectrum is London with nearly 5½ people of working age for every person aged 65 years or over. The differences are much wider still on a more detailed geographic breakdown, with around 12 people of working age for every person aged 65 years and over in the London Borough of Tower Hamlets and less than 1½ in North Norfolk.
The picture is more similar when it comes to young people of schooling age (5 to 19 years): in every English region there are between 3 and 4 people of working age for every person of schooling age.
Total fertility rates vary widely across local authority districts and are too low to replace the population
There were 595,948 live births in England in 2021. The total fertility rate (TFR) for England was 1.62 children per women in 2021, the second lowest since the early 1940s. Westminster had the lowest TFR at 1, while Luton had the highest at 2.23. Luton was also the only local authority district in which TFR exceeded the replacement rate of 2.1 required to stabilise the population in the absence of immigration.

Similarly, age-standardised mortality rates and life expectancy vary widely
In 2021 there were 549,349 deaths from all causes in England, the second highest number since the mid-1970s because of the Covid pandemic. Age-standardised mortality rates (ASMRs), which take account of the population size and age structure of a particular location, vary widely across English regions (and males and females), with the lowest recorded in London at 906 per 100,000 people, followed by the South East (908.7) and South West (913.1). By far the highest was recorded in the North East at 1110.1.
These regional differences are also reflected in life expectancy at birth and later on in life. In the period 2012-14 (the latest available date), male life expectancy at age 65 years ranged from 17.9 years in the North East to 19.3 years in the South East and South West. Female life expectancy at age 65 years was lowest in the North East at 20 years and highest in London at 21.9 years. The differences are much more pronounced on a local authority level, with male life expectancy at age 65 years of 15.9 years in Manchester and 21.6 years in Kensington and Chelsea. Life expectancy was also lowest in Manchester for females (18.8 years) and highest in Camden (24.6 years).
London has the highest share of foreign-born residents but is losing population to other parts of England

International migration statistics are not available on a regional level. In the period July 2022 to June 2023 UK net migration (immigration minus emigration) has been provisionally estimated at 672,000, up from 607,000 in the year-earlier period, and more than twice as high as in any other respective period in previous years. Net migration of EU nationals is now negative, with the sharp jump reflecting net migration of non-EU nationals. The main reason for immigrating to the UK was work, followed by study. Current migration statistics are volatile because of global humanitarian crises.
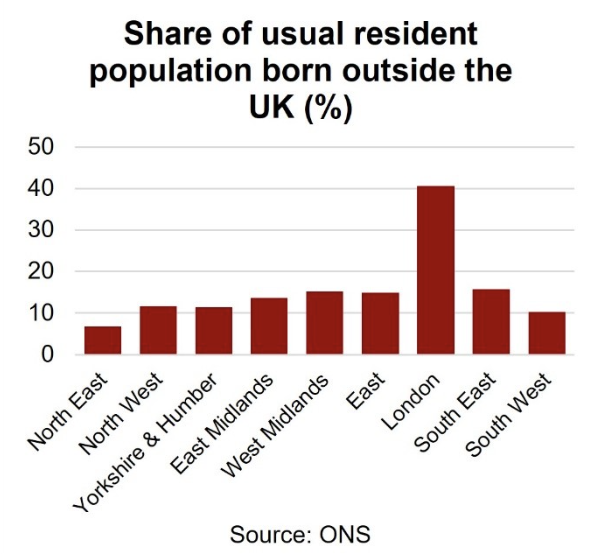
In 2021, the usual resident population in English regions was overwhelmingly born in the UK. The share of those born outside the UK in the resident population was lowest in the North East at 6.8%, followed by the South West at 10.2%. Outside London, the highest share was in the South East at 15.8%. London is the exception with a share of 40.6%.
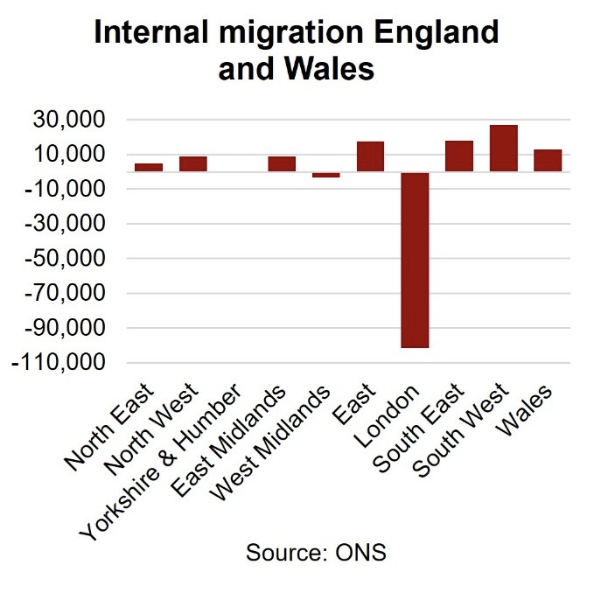
London’s unique population characteristics are also reflected in internal migration. For the year ending in June 2020 (the latest available data), London lost more than 100,000 residents to other English regions, with positive net migration only for those aged between 20 and 29 years. The pattern for London was similar in the previous year, suggesting that this significant outflow was not mainly due to the COVID-19 pandemic in 2020.

Why does it matter?
The size and composition of the UK population on the national, regional and local levels is one of the most important factors policymakers will need to consider when designing and implementing policies. It is of crucial importance for the local labour market and demand for public services at all levels of government. The UK population also differs significantly across the regions and smaller geographical units, giving rise to particular location-specific challenges and opportunities for policymakers.
If you would like to find out more about the topics discussed in this factsheet and what these might mean for your operations, please talk to us.
Suggested further reading
Population estimates for the UK: mid-2021 (Office for National Statistics)
Deaths registered in England and Wales 2021 (Office for National Statistics)
Vital Statistics in the UK: Births, Deaths and Marriages (Office for National Statistics)
Life expectancies (Office for National Statistics)
The Changing picture of long-term international migration (Office for National Statistics)
Long-term international migration Provisional Year Ending June 2023 (Office for National Statistics)
Internal migration by local authority and region (Office for National Statistics)

