Monthly Market Update – June Edition
We are pleased to announce the launch of our monthly Market Update. The update provides a snapshot of key market developments relevant to Local Authorities.


Crafting Clarity in a
World of Complexity

Learn more about
Camdor Global Advisors


Key Takeaways
Capital expenditure by service
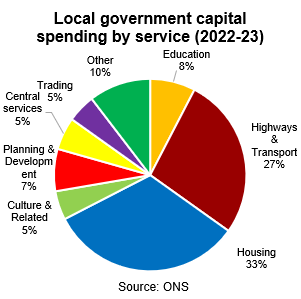
In Fiscal Year (FY) 2022-23 local authorities in England spent £27.5bn on capital expenditure. Of this spending, a third was on housing, just more than a quarter on roads and transport, and just less than a tenth on education. Planning and development services, central services, culture and related services and trading (i.e. the maintenance of civic halls, retail markets and industrial estates etc) together made up nearly a quarter, with the rest spread across services such as police, environment and fire and rescue.
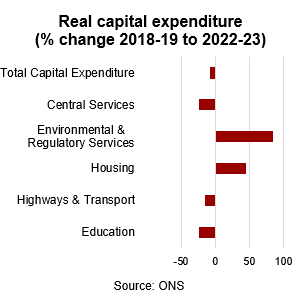
In real terms, the £27.5bn spent on capital expenditure in FY2022-23 represents a 7% decline from the 2018-19 level, with capital spending on education and central services falling by nearly a quarter. Local government capital spending on highways and transport dropped only slightly less (-15.3%). By contrast, local government capital spending on housing increased by nearly 50%, taking its share from 20% of the total in 2018-19 to a third in 2022-23.
Capital expenditure by category
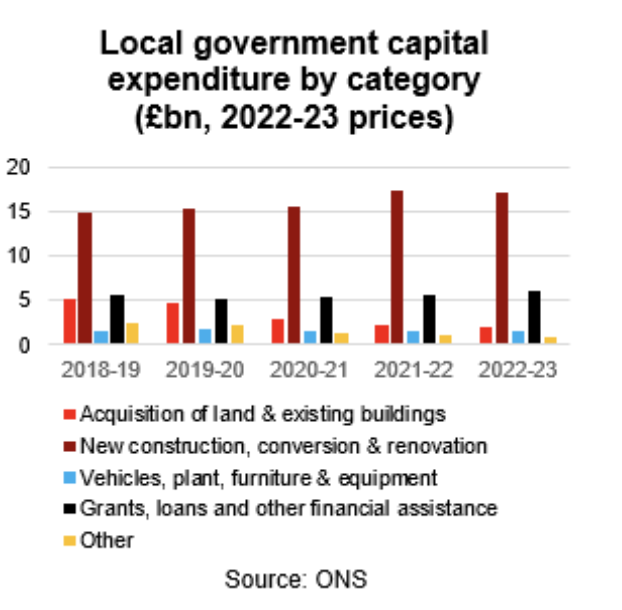
Of the £27.5bn spent in FY 2022-23, £17.2bn was spent on new construction, conversions and renovations, a further £1.9bn on the acquisition of land and existing buildings and £1.6bn on the purchase of vehicles, plant, furniture and other equipment. £6bn was given in the form of grants, loans and other financial assistance to other organisations to invest on behalf of the local authorities.
Over the period 2018-19 to 2022-23, the most notable development was the decline in investment in land and existing buildings. Amounting to £5bn in 2018-19, this more than halved over the following years, explaining the overall decline in local authority capital expenditure.
Revenue sources
The capital expenditure and revenue statistics do not fully match up, with the published expenditure data around £1.5bn lower than the revenue data.
In FY 2022-23, 40% of the resources used to finance capital expenditure came from capital grants, around 20% from revenue resources (including from the housing revenue account, major repairs reserve and CERA) and 10% from capital receipts (incl
uding money received from the selling land, buildings or other capital assets). The remainder – just under a third – was in the form of prudential borrowing. These shares remained relatively stable between 2018-19 and 2022-23.

Local authority net capital stock
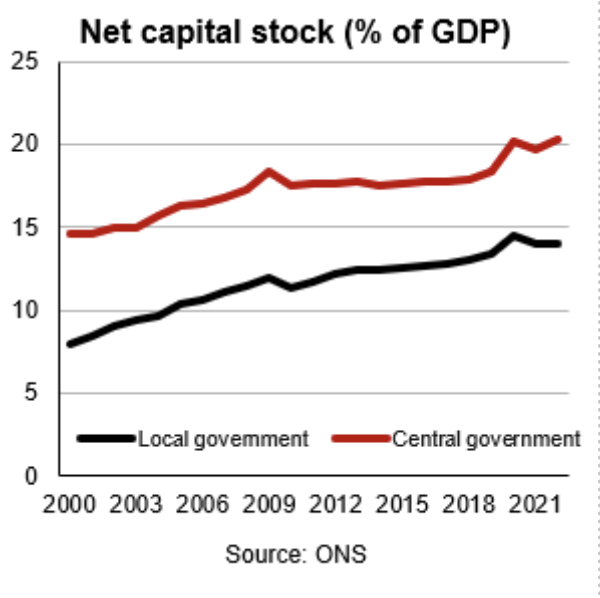
The Office for National Statistics publishes capital stock data for the UK only. As a share of GDP, the net capital stock of local government, that is the market value of fixed assets once deprecation is taken into account, increased from 8% in 2000 to 11% in 2010 and then 14% in 2022.
This is a much more notable increase than that for central government, which increased from 15% in 2000 to 20% in 2022. Other buildings and other structures have made up around 90% of the total net capital stock for local government throughout that period. The remainder is split between land improvements, ICT and other machinery and transport.
Why does it matter?
Local authorities play an important role in providing essential public services such as housing, transportation, and education. Capital expenditure and capital stock trends help to understand how this role is changing over time. Combined with local authority revenue trends they also illustrate the financing gap to be filled by prudential borrowing.
If you would like to discuss what insights and lessons you could take away from local authority capital expenditure and revenue trends in England, please talk to us.
Suggested further reading