Factsheet: Corporate Reporting Standards and Requirements
Key Takeaways
Rapid increase in the number of corporate reporting standards and requirements aimed at raising transparency and accountability and ultimately improving corporate performance.
Reporting requirements cover, among other things, climate- and nature-related financial disclosures, environmental and social sustainability along the value chain, strategy and stress testing.
Insights and lessons learnt are useful for non-corporates such as local governments as well and could help to better address challenges.
There has recently been a proliferation of corporate reporting standards and requirements in the UK and abroad. These new standards and requirements are aimed at raising transparency and accountability and ultimately corporate performance. This factsheet presents some of the key recent and on-going developments.
Since 2022 most large UK companies and LLPs, including banks, insurers, pension schemes and asset managers and owners report climate-related financial information in their non-financial and sustainability information statement as part of their Strategic Report. Where no Strategic Report is being prepared, the information will need to be disclosed in an Energy and Carbon Report as part of the Annual Report.
Companies and LLPs within scope have to disclose information on climate-related risks and opportunities, where these are financially material. The disclosures need to address how climate change is addressed in corporate governance; how it might impact strategy; how related risks and opportunities are managed; and the performance measures and targets applied in managing these issues.
Nature-related financial disclosures
In September 2023 the Taskforce on Nature-related Financial Disclosures published its recommendations to complement the 2017 climate recommendations. The taskforce has started discussions with jurisdictions on adoption and has stated that the recommendations are suitable for organisations of all sizes, sectors and value chains.
The recommendations set out the suggested disclosure framework and 14 desirable disclosures. They are consistent with the language, structure and approach of both the TCFD and the International Sustainability Standards Board (ISSB) to enable integrated climate- and nature-related reporting.
Of the 14 recommended disclosures three deal with governance; four with strategy; four with risk and impact management; and three with metrics and targets.
Non-financial reporting
Corporate Sustainability Reporting
In January 2023 the EU Corporate Sustainability Reporting Directive (CSRD) entered into force. Companies subject to the CSRD will have to report according to European Sustainability Reporting Standards. These standards take a ‘double materiality’ perspective, in other words companies will need to report on how environmental and social issues might create financial risks and opportunities for the business and how the business might impact on the environment and society
The standards require 12 disclosures on issues such as climate, pollution, water and marine resources, biodiversity, circular economy, own workforce, affected communities and business conduct. The EU Corporate Sustainability Reporting Directive is closely aligned with the ISSB’s International Financial Reporting Standards (IFRS) S1 and S2.
The UK government is currently working on its own corporate sustainability disclosure standards, which should also be closed aligned with (and based on) the IFRS. In July 2023 the UK Financial Reporting Council called for evidence on UK endorsement of IFRS S1 and S2. The UK sustainability standards might come into force in 2025. In January 2024 the UK Financial Reporting Council published its UK Corporate Governance Code 2024, updating the current 2018 code, covering companies with a premium listing on the London Stock Exchange.
Corporate Due Diligence
The EU is also in the process of implementing its Corporate Sustainability Due Diligence Directive (CSDDD). The CSDDD establishes a comprehensive framework for larger companies operating in the EU of corporate due diligence to identify actual or potential risks to human rights and the environment and establish mitigating actions. The rules would apply to the entire (potentially global) upstream and downstream value chain. The directive will come into force this year.
Strategic Report and Directors’ Report (Amendment) Regulations 2023
The UK Parliament is currently debating the Draft Companies (Strategic Report and Directors’ Report) (Amendment) Regulations 2023. If approved, it would apply to UK companies with at least 750 employees and an annual turnover of at least £750 million and would comprise an annual resilience statement, and annual distributable profits figure and an annual material fraud statement.
In the annual resilience statement companies would be required to explain the steps they are taking to build or maintain their business resilience over the short, medium and long term. This would include a summary of the company’s strategic approach to managing risk and building or maintaining business resilience (including how risk and resilience are considered within the company’s business planning and investment cycle, and within relevant internal governance processes); a description of the main risks; a reverse stress test identifying mitigating actions to deal with potential adverse circumstances; and a summary of long-term trends or factors that could threaten the business model or operations.
The framework identifies five elements of a good practice transition plan: foundations (strategic ambition of the plan); implementation Strategy (actions taken to achieve its strategic ambition, as well as the resulting implications for its financial position, financial performance, and cash flows); engagement strategy (with regards value chain, industry peers, government, public sector, communities, and civil society); metrics and targets (used to drive and monitor progress towards strategic ambition); and governance (how is transition plan embedded in governance structures and organisational arrangements).
Why does it matter?
Corporate reporting standards and requirements aim to improve transparency and accountability and ultimately help businesses perform better, for example by identifying key risks and developing mitigating actions. Corporate reporting requirements could therefore also provide insights and lessons for non-corporates such as local governments.
If you would like to find out more about the topics discussed in this factsheet and what insights and lessons you could take away from corporate reporting requirements to address the challenges you face, please talk to us.
In 2022-23 public-sector net borrowing excl. public-sector banks amounted to 5.1% of GDP. Central government is responsible for the overwhelming share of public-sector net borrowing.
In 2022-23 public-sector net debt was close to 100% of GDP – about average for an advanced…
The population of England is growing and ageing rapidly. The South West has by far the oldest population, London the youngest.
The total fertility rate varies widely across local authority districts and is not high enough to replace the population. Similarly, age-standardised…
In 2022-23 English local authorities spent a third of their capital expenditure on housing and about a quarter on highways and transport. In 2022-23 capital expenditure, which was down by 7% in real terms on 2018-19, was mainly used for new…
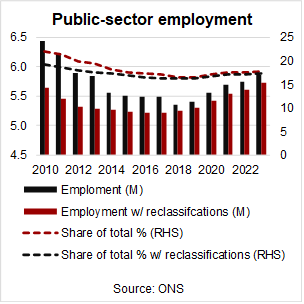
The share of public-sector employment in total employment has been relatively stable once reclassification effects are taken into account. In 2023 around 17% of the total workforce worked in the public sector. With NHS employment rising, the share of central government…
Average earth surface temperature is now ~1.1°C higher than before the industrial revolution. Ocean surface temperature also increased significantly. There is clear scientific evidence that recent climate change is man made.
Climate change manifests itself in rising temperatures and changing weather patterns….
Factsheet: Public-sector Employment and Wage Trends
Key Takeaways
The share of public-sector employment in total employment has been relatively stable once reclassification effects are taken into account. In 2023 around 17% of the total workforce worked in the public sector. With NHS employment rising, the share of central government employment in public-sector employment is on the increase.
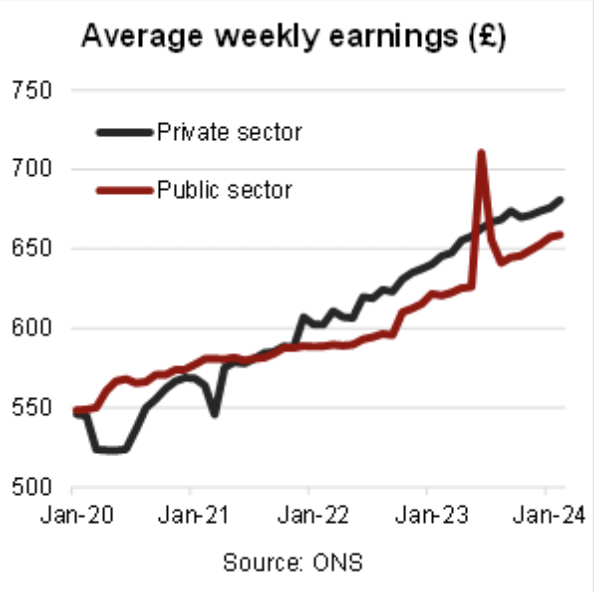
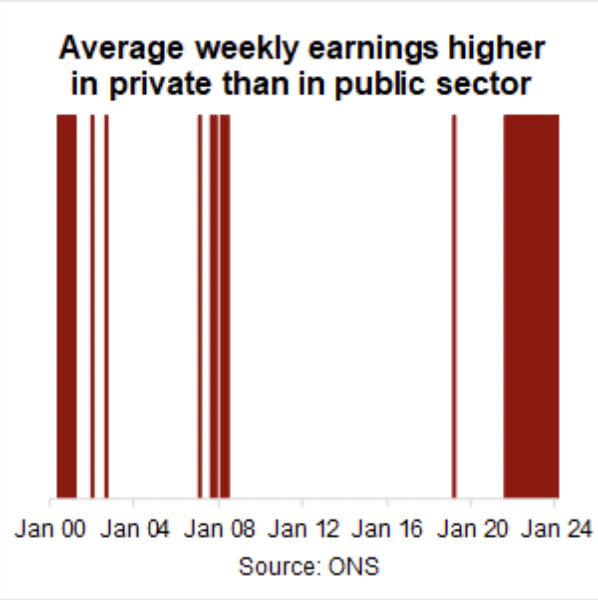
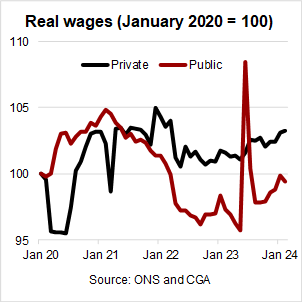
Since mid-2021 average weekly earnings have been higher in the private than in the public sector. Since the beginning of the century this has only otherwise been the case in 2000. Moreover, there has been a compression of pay within the public sector. Historically average weekly earnings have been higher in the public than in the private sector as educational attainment and skills are generally higher in the former.
Between mid-2021 and mid-2023 public-sector real wage growth was negative, with the result that real average weekly earnings have still not returned to pre-Covid levels. By contrast, real average weekly earnings in the private sector have been higher than pre-Covid with the exception of the furlough period in 2020.
The share of public-sector employment in total employment has been relatively stable once reclassification effects are taken into account
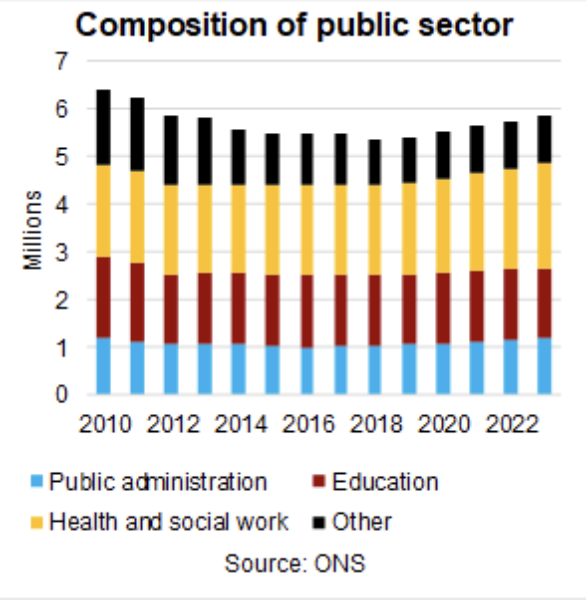
The share of public-sector employment in total UK employment dropped from 22% in 2010 to around 16.5% in 2018 and has since only gradually increased again. In absolute numbers public-sector employment was – at 5.9m – around 560,000 lower in 2023 than in 2010.
However, these headline changes reflect more sectoral reclassifications than actual trends. Among other reclassification changes, Further Education and Sixth Form College corporations in England were included in the public sector before mid-20212 but have been included in the private sector since then. Going the other way, Lloyds Banking Group plc and Royal Mail plc were reclassified from the public to the private sector at the end 2013. Once these reclassification changes are taken into account, the drop in the share of public-sector employment in total employment was much more modest and public-sector employment was in fact marginally higher in absolute terms in 2023 than in 2012.
The share of public-sector employment in total employment varies considerably across the regions of the UK. In 2023, in the East and South East only 15% of the total workforce was employed in the public sector. This contrasts with 26% in Northern Ireland.
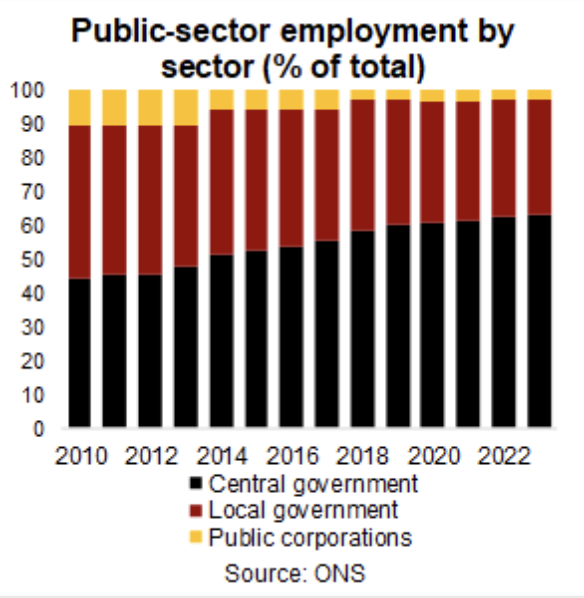
Within the public sector, central government is taking an ever larger employment share, rising from 44% in 2010 to 62% in 2023. Both local government and public corporations saw declines in their shares over that period.
Much of this can be explained by the rapid rise in NHS employment, which went from 1.6m in 2010 to 2m in 2023. By contrast, employment in the civil service and in education remained reasonably stable over that period.
Since mid-2021 earnings have been higher in the private than in the public sector, reversing a long-term trend
Average weekly earnings in the private sector dropped sharply at the onset of the Covid pandemic in early-2020 when many workers were moved to the government’s furlough employment support scheme. Average weekly earnings recovered quickly though and with the exception of March 2021 (when bonus pay was below trend) has seen steady growth since.
By contrast, average weekly earnings in the public sector continued to grow during the first year of the Covid pandemic but then trended sideways until early-2023. Since then it has grown more or less in line with private-sector earnings (the spike in June 2023 reflects the one-off bonus payment to NHS workers).
Notably, as a result of these diverging trends, average weekly earnings in the private sector have been higher than in the public sector since mid-2021.
This contrasts with the long-term trend. In the 290 months between January 2000 and February 2024, average weekly earnings in the private sector were higher than in the public sector in only 49 of them (16%) – 30 of which since mid-2021. The last time average weekly earnings in the private sector were higher than in the public sector over several consecutive months was in 2000.
According to the Institute of Fiscal Studies, several professions in the public sector including nurses but in particular teachers and hospital doctors have experienced much worse pay growth than the average public-sector worker. This reflects a (deliberate) compression of public-sector pay within and across professions. This contrasts with developments in the private sector over the same period. Historically average pay in the public sector has been higher than in the private sector as the average level of educational attainment and skills is higher in the former than in the latter.
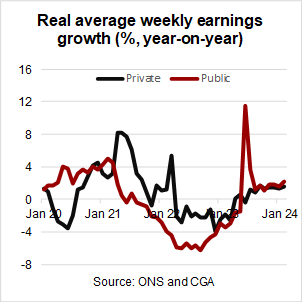
Between mid-2021 and mid-2023 public-sector real wage growth was negative
With consumer price inflation accelerating from early-2021 onwards (taking annual CPIH from 0.8% in December 2020 to a peak of 9.6% in October 2022), moderate nominal average weekly earnings growth initially turned into modest real growth and then negative real growth. This was particularly notable in the public sector: in the 24 months between July 2021 and June 2023, real average weekly earnings growth was negative in 22 of them. In the private sector this was the case in 14 out of those 24 months.
As a result (and ignoring the one-off spike in June 2023), real average weekly earnings in the public sector were well below their pre-Covid level between mid-2022 and late-2023 and are only now close to pre-pandemic levels. This contrasts with developments in the private sector, where real wages have been higher than pre-Covid since the end of the furlough period.
Why does it matter?
Public-sector pay accounts for a large part of the public-sector spending and as such plays an important role in the financial stability of local governments and other public-sector bodies. Recent earnings trends show a compression of public-sector pay within and across professions, with the result that public-sector average weekly earnings have fallen behind those in the private sector. This suggests that public-sector wages in general and for certain professions in particular face significant upward pressure, potentially straining public-sector budgets even further.
If you would like to discuss what insights and lessons you could take away from recent public-sector and private-sector employment and wage trends, please talk to us.
In 2022-23 public-sector net borrowing excl. public-sector banks amounted to 5.1% of GDP. Central government is responsible for the overwhelming share of public-sector net borrowing.
In 2022-23 public-sector net debt was close to 100% of GDP – about average for an advanced…
The population of England is growing and ageing rapidly. The South West has by far the oldest population, London the youngest.
The total fertility rate varies widely across local authority districts and is not high enough to replace the population. Similarly, age-standardised…
In 2022-23 English local authorities spent a third of their capital expenditure on housing and about a quarter on highways and transport. In 2022-23 capital expenditure, which was down by 7% in real terms on 2018-19, was mainly used for new…
Rapid increase in the number of corporate reporting standards and requirements aimed at raising transparency and accountability and ultimately improving corporate performance.
Reporting requirements cover, among other things, climate- and nature-related financial disclosures, environmental and social sustainability along the value chain, strategy…
Average earth surface temperature is now ~1.1°C higher than before the industrial revolution. Ocean surface temperature also increased significantly. There is clear scientific evidence that recent climate change is man made.
Climate change manifests itself in rising temperatures and changing weather patterns….
Factsheet: Local Government Capital Expenditure and Stock
Key Takeaways
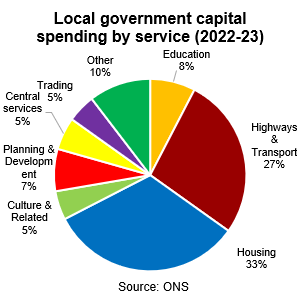
In 2022-23 English local authorities spent a third of their capital expenditure on housing and about a quarter on highways and transport. In 2022-23 capital expenditure, which was down by 7% in real terms on 2018-19, was mainly used for new constructions, conversion and renovations.
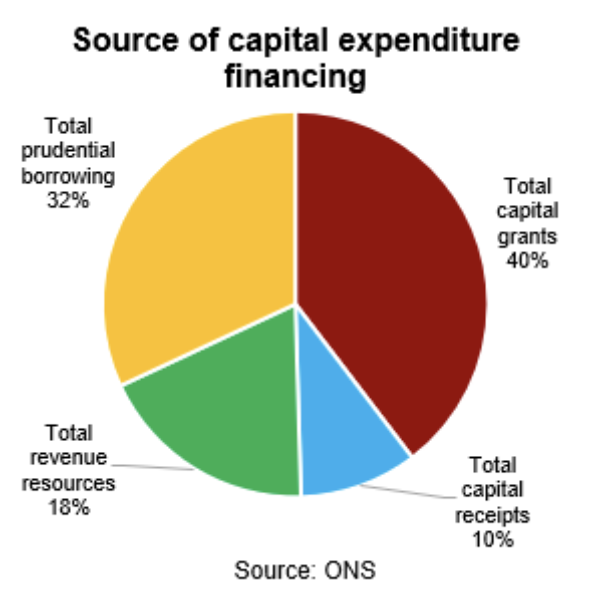
The main source of revenue to finance capital expenditure were capital grants, followed by prudential borrowing. The sources of revenue have remained relatively stable between 2018-19 and 2022-23.
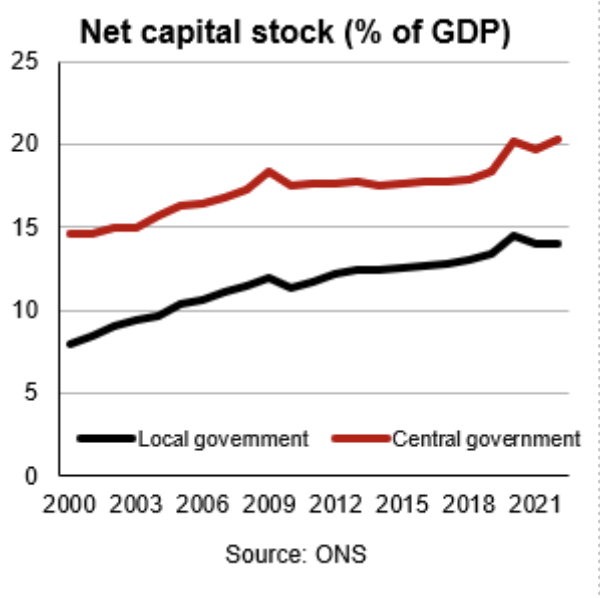
The net capital stock of local government in the UK increased from 8% of GDP in 2000 to 14% of GDP in 2022. Other buildings and other structures make up the bulk of the net capital stock.
Capital expenditure by service
In Fiscal Year (FY) 2022-23 local authorities in England spent £27.5bn on capital expenditure. Of this spending, a third was on housing, just more than a quarter on roads and transport, and just less than a tenth on education. Planning and development services, central services, culture and related services and trading (i.e. the maintenance of civic halls, retail markets and industrial estates etc) together made up nearly a quarter, with the rest spread across services such as police, environment and fire and rescue.
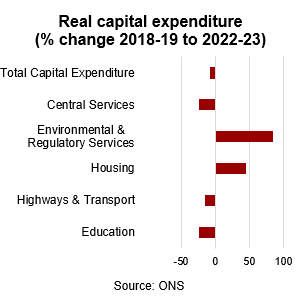
In real terms, the £27.5bn spent on capital expenditure in FY2022-23 represents a 7% decline from the 2018-19 level, with capital spending on education and central services falling by nearly a quarter. Local government capital spending on highways and transport dropped only slightly less (-15.3%). By contrast, local government capital spending on housing increased by nearly 50%, taking its share from 20% of the total in 2018-19 to a third in 2022-23.
Capital expenditure by category
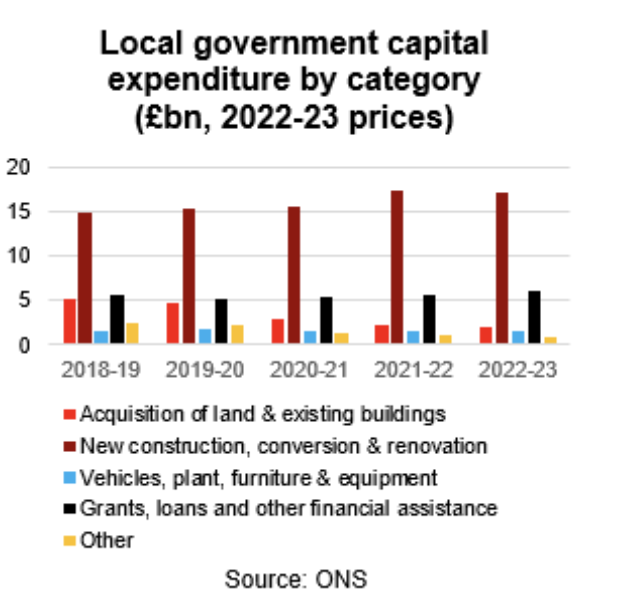
Of the £27.5bn spent in FY 2022-23, £17.2bn was spent on new construction, conversions and renovations, a further £1.9bn on the acquisition of land and existing buildings and £1.6bn on the purchase of vehicles, plant, furniture and other equipment. £6bn was given in the form of grants, loans and other financial assistance to other organisations to invest on behalf of the local authorities.
Over the period 2018-19 to 2022-23, the most notable development was the decline in investment in land and existing buildings. Amounting to £5bn in 2018-19, this more than halved over the following years, explaining the overall decline in local authority capital expenditure.
Revenue sources
The capital expenditure and revenue statistics do not fully match up, with the published expenditure data around £1.5bn lower than the revenue data.
In FY 2022-23, 40% of the resources used to finance capital expenditure came from capital grants, around 20% from revenue resources (including from the housing revenue account, major repairs reserve and CERA) and 10% from capital receipts (incl
uding money received from the selling land, buildings or other capital assets). The remainder – just under a third – was in the form of prudential borrowing. These shares remained relatively stable between 2018-19 and 2022-23.
Local authority net capital stock
The Office for National Statistics publishes capital stock data for the UK only. As a share of GDP, the net capital stock of local government, that is the market value of fixed assets once deprecation is taken into account, increased from 8% in 2000 to 11% in 2010 and then 14% in 2022.
This is a much more notable increase than that for central government, which increased from 15% in 2000 to 20% in 2022. Other buildings and other structures have made up around 90% of the total net capital stock for local government throughout that period. The remainder is split between land improvements, ICT and other machinery and transport.
Why does it matter?
Local authorities play an important role in providing essential public services such as housing, transportation, and education. Capital expenditure and capital stock trends help to understand how this role is changing over time. Combined with local authority revenue trends they also illustrate the financing gap to be filled by prudential borrowing.
If you would like to discuss what insights and lessons you could take away from local authority capital expenditure and revenue trends in England, please talk to us.
In 2022-23 public-sector net borrowing excl. public-sector banks amounted to 5.1% of GDP. Central government is responsible for the overwhelming share of public-sector net borrowing.
In 2022-23 public-sector net debt was close to 100% of GDP – about average for an advanced…
The population of England is growing and ageing rapidly. The South West has by far the oldest population, London the youngest.
The total fertility rate varies widely across local authority districts and is not high enough to replace the population. Similarly, age-standardised…
The share of public-sector employment in total employment has been relatively stable once reclassification effects are taken into account. In 2023 around 17% of the total workforce worked in the public sector. With NHS employment rising, the share of central government…
Rapid increase in the number of corporate reporting standards and requirements aimed at raising transparency and accountability and ultimately improving corporate performance.
Reporting requirements cover, among other things, climate- and nature-related financial disclosures, environmental and social sustainability along the value chain, strategy…
Average earth surface temperature is now ~1.1°C higher than before the industrial revolution. Ocean surface temperature also increased significantly. There is clear scientific evidence that recent climate change is man made.
Climate change manifests itself in rising temperatures and changing weather patterns….
In 2022-23 public-sector net borrowing excl. public-sector banks amounted to 5.1% of GDP. Central government is responsible for the overwhelming share of public-sector net borrowing.
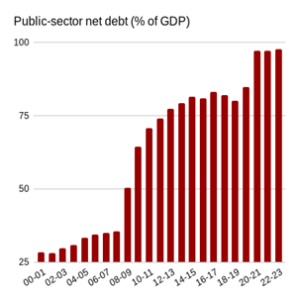
In 2022-23 public-sector net debt was close to 100% of GDP – about average for an advanced economy. Public-sector debt jumped sharply during the financial crisis and increased further because of the Covid pandemic.
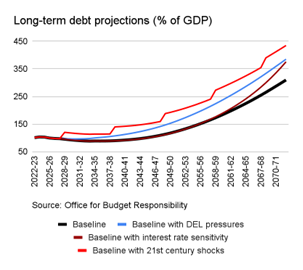
Long-term projections show that net debt could increase to around 300% of GDP by the 2070s due to population ageing. It could be higher once other potential challenges are factored in.
Public-sector borrowing and debt
The UK public finances are generally reported on the level of the public sector excluding public-sector banks. This covers central and local government, public corporations, funded public-sector pensions and the Bank of England.
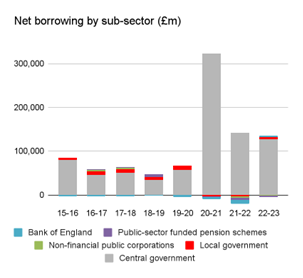
Public-sector net borrowing excluding public-sector banks (PSNB ex) amounted to £119.1bn in the first three quarters of the 2023-24 financial year (FY), the fourth highest on record for that period. In the second half of the last decade PSNB ex was generally around half as high in the respective periods.
PSNB ex for the full FY 2022-23 amounted to £130.1bn, equivalent to 5.1% of GDP, marginally lower than in 2021-22 but significantly smaller than the 15% recorded in 2020-21 as a result of the Covid pandemic. The share is also lower than in any FY between 2008-09 and 2013-14.
Central government is historically responsible for most of the public-sector net borrowing. In 2022-23 central government and local government borrowed £127.8bn and £10.7bn respectively on a net basis, with non-financial public corporations and funded public-sector pensions reporting small surpluses. In previous years the Bank of England also recorded small surpluses. Transfers between the sub-sectors are netted out of the statistics.
The UK government’s preferred measure of debt is on a net basis excluding public-sector banks (PSND ex). In December 2023 PSND ex stood at 97.7% of GDP, a level last seen in the early 1960s. PSND ex increased from ~35% of GDP at the end of 2007-08 to ~85% of GDP mid last decade because of the financial crisis. It jumped to nearly 100% of GDP in 2020-21 as a result of the Covid pandemic.
International public finance comparisons are commonly made on a general government gross basis. As a share of GDP, UK gross general government debt was lower in 2022 (at 101.9%) than in France (at 111.1%), the United States (at 121.3%) but higher than in Germany (at 66.1%). The G7 average was 128%, much of it reflecting Japan’s high debt level (at 260.1% of GDP).
Fiscal plans and targets
The government announced in its 2023 Autumn Statement to reduce public-sector net borrowing from an estimated ~4.5% of GDP in 2023-24 to below 2% of GDP by 2027-28 so that net debt could start falling as a share of GDP within the next five years – one of the government’s fiscal targets. In 2023-24 social protection and health spending should make up nearly half of total managed expenditure, while debt interest payments account for around 10% – only marginally less than education spending.
Fiscal sustainability
The Office for Budget Responsibility (OBR), the UK’s official independent fiscal watchdog, regularly assesses the long-term sustainability of the UK public finances. The OBR projects the PSND ex to GDP ratio to fall slightly over coming years but then to increase sharply over coming decades as a result of population ageing. In the OBR’s baseline scenario PSND ex reaches 150% of GDP by mid-century and more than 300% by the early 2070s. According to the OBR, this is probably an underestimate as many potential risks are not considered in the baseline. For example, reasonably assuming that debt interest rates rise as the government becomes more indebted could take PSND ex to around 375% of GDP by the early 2070s.
Why does it matter?
The UK public finances are a crucial part of the economic and financial environment within which local authorities operate. Fiscal pressures are on the increase at all levels of government, while raising sufficient revenue remains challenging. Local authorities will need to learn to operate within tight fiscal constraints for years to come, making it ever more important to prioritise and seek efficiency gains.
If you would like to find out more about the topics discussed in this factsheet and what these might mean for your operations, please talk to us.
The population of England is growing and ageing rapidly. The South West has by far the oldest population, London the youngest.
The total fertility rate varies widely across local authority districts and is not high enough to replace the population. Similarly, age-standardised…
In 2022-23 English local authorities spent a third of their capital expenditure on housing and about a quarter on highways and transport. In 2022-23 capital expenditure, which was down by 7% in real terms on 2018-19, was mainly used for new…
The share of public-sector employment in total employment has been relatively stable once reclassification effects are taken into account. In 2023 around 17% of the total workforce worked in the public sector. With NHS employment rising, the share of central government…
Rapid increase in the number of corporate reporting standards and requirements aimed at raising transparency and accountability and ultimately improving corporate performance.
Reporting requirements cover, among other things, climate- and nature-related financial disclosures, environmental and social sustainability along the value chain, strategy…
Average earth surface temperature is now ~1.1°C higher than before the industrial revolution. Ocean surface temperature also increased significantly. There is clear scientific evidence that recent climate change is man made.
Climate change manifests itself in rising temperatures and changing weather patterns….
The population of England is growing and ageing rapidly. The South West has by far the oldest population, London the youngest.
The total fertility rate varies widely across local authority districts and is not high enough to replace the population. Similarly, age-standardised mortality rates and life expectancy varies widely across England.
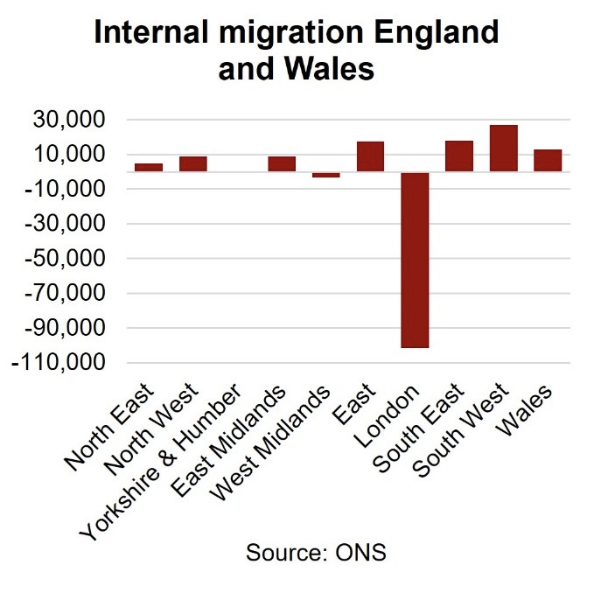
In 2021 net migration stood at nearly 500,000. London has the highest share of foreign-born residents, the North East the lowest. London is losing population to other regions in England.
The population of England is growing and ageing
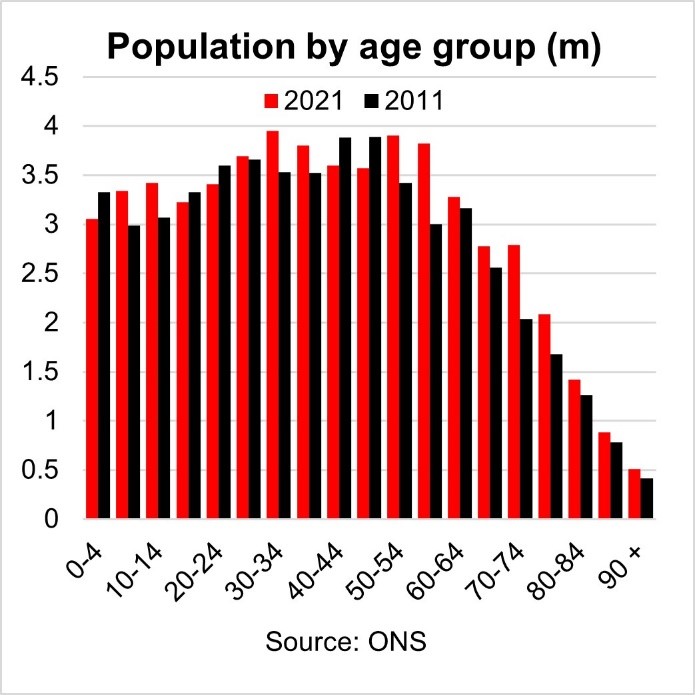
In mid-2021 the resident population in England was 56.5m, up from 53.1m in mid-2011 (+6.6%). There were marginally more women than men (51% vs 49%), while the median age was 40.5 years, up from 39.4 years a decade earlier.
Between mid-2011 and mid-2022 the number of people aged 0 to 19 years increased by 2.6%, that of people aged 20 to 64 years (commonly defined as ‘the working age’) by 4.3% and that of people aged 65 years and over by 19.9%. As a result, for every person aged 65 years and over there were around three people of working age – down from nearly four people in mid-2011. This is referred to as the old-age dependency ratio.
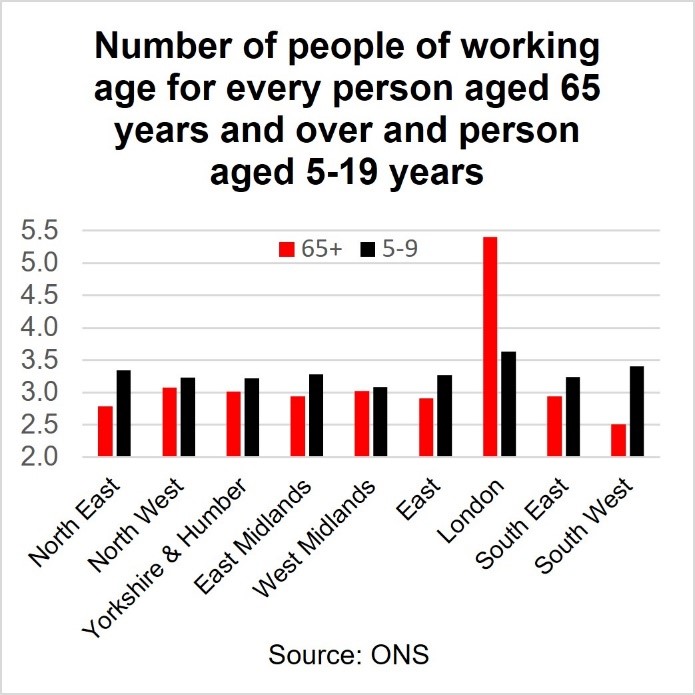
London and the South West stand out among English regions in terms of age structure
The age structure among English regions varies considerably. In terms of the old-age dependency ratio, the South West has by far the oldest population of all the English regions, with only 2½ people of working age for every person aged 65 years and over, followed by the North East at 2¾. At the other end of the spectrum is London with nearly 5½ people of working age for every person aged 65 years or over. The differences are much wider still on a more detailed geographic breakdown, with around 12 people of working age for every person aged 65 years and over in the London Borough of Tower Hamlets and less than 1½ in North Norfolk.
The picture is more similar when it comes to young people of schooling age (5 to 19 years): in every English region there are between 3 and 4 people of working age for every person of schooling age.
Total fertility rates vary widely across local authority districts and are too low to replace the population
There were 595,948 live births in England in 2021. The total fertility rate (TFR) for England was 1.62 children per women in 2021, the second lowest since the early 1940s. Westminster had the lowest TFR at 1, while Luton had the highest at 2.23. Luton was also the only local authority district in which TFR exceeded the replacement rate of 2.1 required to stabilise the population in the absence of immigration.
Similarly, age-standardised mortality rates and life expectancy vary widely
In 2021 there were 549,349 deaths from all causes in England, the second highest number since the mid-1970s because of the Covid pandemic. Age-standardised mortality rates (ASMRs), which take account of the population size and age structure of a particular location, vary widely across English regions (and males and females), with the lowest recorded in London at 906 per 100,000 people, followed by the South East (908.7) and South West (913.1). By far the highest was recorded in the North East at 1110.1.
These regional differences are also reflected in life expectancy at birth and later on in life. In the period 2012-14 (the latest available date), male life expectancy at age 65 years ranged from 17.9 years in the North East to 19.3 years in the South East and South West. Female life expectancy at age 65 years was lowest in the North East at 20 years and highest in London at 21.9 years. The differences are much more pronounced on a local authority level, with male life expectancy at age 65 years of 15.9 years in Manchester and 21.6 years in Kensington and Chelsea. Life expectancy was also lowest in Manchester for females (18.8 years) and highest in Camden (24.6 years).
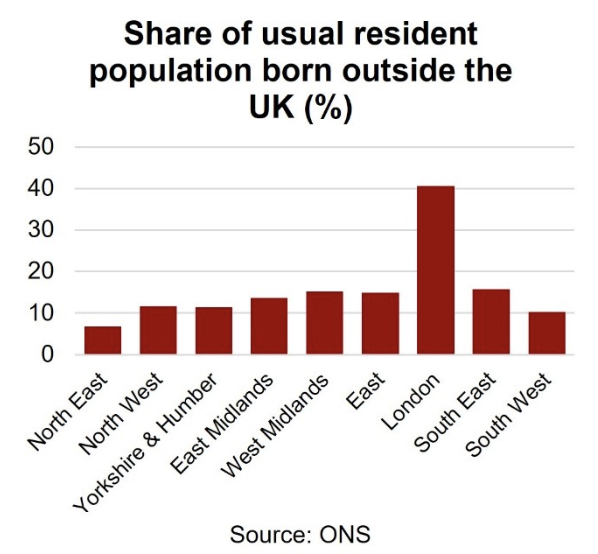
London has the highest share of foreign-born residents but is losing population to other parts of England
International migration statistics are not available on a regional level. In the period July 2022 to June 2023 UK net migration (immigration minus emigration) has been provisionally estimated at 672,000, up from 607,000 in the year-earlier period, and more than twice as high as in any other respective period in previous years. Net migration of EU nationals is now negative, with the sharp jump reflecting net migration of non-EU nationals. The main reason for immigrating to the UK was work, followed by study. Current migration statistics are volatile because of global humanitarian crises.
In 2021, the usual resident population in English regions was overwhelmingly born in the UK. The share of those born outside the UK in the resident population was lowest in the North East at 6.8%, followed by the South West at 10.2%. Outside London, the highest share was in the South East at 15.8%. London is the exception with a share of 40.6%.
London’s unique population characteristics are also reflected in internal migration. For the year ending in June 2020 (the latest available data), London lost more than 100,000 residents to other English regions, with positive net migration only for those aged between 20 and 29 years. The pattern for London was similar in the previous year, suggesting that this significant outflow was not mainly due to the COVID-19 pandemic in 2020.
Why does it matter?
The size and composition of the UK population on the national, regional and local levels is one of the most important factors policymakers will need to consider when designing and implementing policies. It is of crucial importance for the local labour market and demand for public services at all levels of government. The UK population also differs significantly across the regions and smaller geographical units, giving rise to particular location-specific challenges and opportunities for policymakers.
If you would like to find out more about the topics discussed in this factsheet and what these might mean for your operations, please talk to us.
In 2022-23 public-sector net borrowing excl. public-sector banks amounted to 5.1% of GDP. Central government is responsible for the overwhelming share of public-sector net borrowing.
In 2022-23 public-sector net debt was close to 100% of GDP – about average for an advanced…
In 2022-23 English local authorities spent a third of their capital expenditure on housing and about a quarter on highways and transport. In 2022-23 capital expenditure, which was down by 7% in real terms on 2018-19, was mainly used for new…
The share of public-sector employment in total employment has been relatively stable once reclassification effects are taken into account. In 2023 around 17% of the total workforce worked in the public sector. With NHS employment rising, the share of central government…
Rapid increase in the number of corporate reporting standards and requirements aimed at raising transparency and accountability and ultimately improving corporate performance.
Reporting requirements cover, among other things, climate- and nature-related financial disclosures, environmental and social sustainability along the value chain, strategy…
Average earth surface temperature is now ~1.1°C higher than before the industrial revolution. Ocean surface temperature also increased significantly. There is clear scientific evidence that recent climate change is man made.
Climate change manifests itself in rising temperatures and changing weather patterns….
Average earth surface temperature is now ~1.1°C higher than before the industrial revolution. Ocean surface temperature also increased significantly. There is clear scientific evidence that recent climate change is man made.
Climate change manifests itself in rising temperatures and changing weather patterns. Climate change can also explain recent increases in temperatures in the UK.
Globally, climate change has affected biodiversity, water supply, flooding and wildfires, crop failures and food security. In UK temperature-related excess mortality has so far fallen.
What is climate change?
Climate change refers to long-term changes in temperatures (i.e. global warming) and weather patterns. The earth’s climate has changed throughout history, so the phenomenon is not new. What is new is the speed and magnitude of change recorded over recent decades.
According to the United Nations (UN), the average temperature of the earth’s surface is now ~1.1°C higher than it was before the industrial revolution and the highest in the last 100,000 years. The decade between 2011 and 2020 was the warmest on record, and each of the last four decades has been warmer than any previous decade since 1850. Moreover, July 2023 was by far the hottest July on record and likely the hottest it has been in 120,000 years.
According to the UN, there is overwhelming scientific evidence that climate change over the last two centuries is man made.
How does it manifest itself?
Beyond an increasing average temperature of the earth’s surface, climate change manifests itself in many other ways. For example, over the last four decades the global mean sea surface temperature has increased by ~0.6°C – according to NASA, around 9/10th of global warming is occurring in the oceans. Increasing ocean temperatures have been linked to increasing hurricane intensity, while rising temperature levels generally have accelerated the melting of polar ice caps, resulting in rising sea levels (these have risen by more than 20 cm since 1880), and of glaciers in the mountain ranges of the world.
Changing weather patterns are also reflected in changing global patterns of precipitation, for example in less frequent but more intense rainfall, and wind patterns, both in terms of direction and speed. The impact of climate change will vary across regions or even local areas.
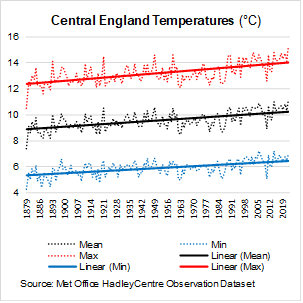
According to the Met Office climate change can also explain the rise in more intense and frequent warm spells and fall in more intense and frequent cold spells in the UK. Central England temperatures have risen markedly since records began in the 1880s. The linkage to heavy rains, dry spells and storms remains inconclusive though.
What are the consequences globally?
Consequences include:
rising land temperatures which affect biodiversity and wildlife and raise risk of wildfires (e.g. Australia 2019/20, USA 2020, Canada 2023), potentially hitting human settlements
rising sea levels which raise the risk of coastal flooding, potentially hitting human settlements
lack of new snow fall and melting glaciers which raise risk of water shortages, for example in the Americas (e.g. Maipo river basin in the Andes, Colorado river basin in the Rocky Mountains) and in South Asia (e.g. Indus river basin in the Himalaya)
extended and less predictable dry spells which raise risk of droughts, crop failures and food insecurity, potentially making regions uninhabitable and triggering international migration
more intense rain falls which raise risk of river flooding, potentially hitting human settlements
rising sea temperatures which affect biodiversity and sealife. More frequent and strong hurricanes, cyclones and typhoons could hit human settlements
excess mortality as a result of more frequent and extreme heatwaves.
What are the consequences in the UK?
According to the UK Government Actuary’s Department, the net effect of temperature change on excess mortality – that is the number of deaths above what would be expected under ‘normal’ conditions – so far has been negative, with lower excess deaths as a result of milder winters more than offsetting higher excess deaths as a result of hotter summers.
Why does it matter?
Climate change is one of the biggest challenges facing societies in the UK and elsewhere. Climate change has been rapid over recent decades and is, if anything, expected to accelerate in the decades ahead, with potentially significant adverse consequences for the UK. Local councils need to prepare for these inevitable changes and will need to make their contribution to slow down climate change.
If you would like to find out more about the topics discussed in this factsheet and how we might be able to help you with ESG reporting, please talk to us.
In 2022-23 public-sector net borrowing excl. public-sector banks amounted to 5.1% of GDP. Central government is responsible for the overwhelming share of public-sector net borrowing.
In 2022-23 public-sector net debt was close to 100% of GDP – about average for an advanced…
The population of England is growing and ageing rapidly. The South West has by far the oldest population, London the youngest.
The total fertility rate varies widely across local authority districts and is not high enough to replace the population. Similarly, age-standardised…
In 2022-23 English local authorities spent a third of their capital expenditure on housing and about a quarter on highways and transport. In 2022-23 capital expenditure, which was down by 7% in real terms on 2018-19, was mainly used for new…
The share of public-sector employment in total employment has been relatively stable once reclassification effects are taken into account. In 2023 around 17% of the total workforce worked in the public sector. With NHS employment rising, the share of central government…
Rapid increase in the number of corporate reporting standards and requirements aimed at raising transparency and accountability and ultimately improving corporate performance.
Reporting requirements cover, among other things, climate- and nature-related financial disclosures, environmental and social sustainability along the value chain, strategy…
Stay connected and never miss out on exclusive updates and breaking news. Join our mailing list today for a world of benefits delivered right to your inbox. Sign up now and be a part of our thriving community.