Local Government Reorganisation: What Councils Inherit on Day one
Local Government Reorganisation is often discussed in terms of boundaries and governance.



Crafting Clarity in a
World of Complexity

Learn more about
Camdor Global Advisors


Key Takeaways
The share of public-sector employment in total employment has been relatively stable once reclassification effects are taken into account
The share of public-sector employment in total UK employment dropped from 22% in 2010 to around 16.5% in 2018 and has since only gradually increased again. In absolute numbers public-sector employment was – at 5.9m – around 560,000 lower in 2023 than in 2010.

However, these headline changes reflect more sectoral reclassifications than actual trends. Among other reclassification changes, Further Education and Sixth Form College corporations in England were included in the public sector before mid-20212 but have been included in the private sector since then. Going the other way, Lloyds Banking Group plc and Royal Mail plc were reclassified from the public to the private sector at the end 2013. Once these reclassification changes are taken into account, the drop in the share of public-sector employment in total employment was much more modest and public-sector employment was in fact marginally higher in absolute terms in 2023 than in 2012.
The share of public-sector employment in total employment varies considerably across the regions of the UK. In 2023, in the East and South East only 15% of the total workforce was employed in the public sector. This contrasts with 26% in Northern Ireland.
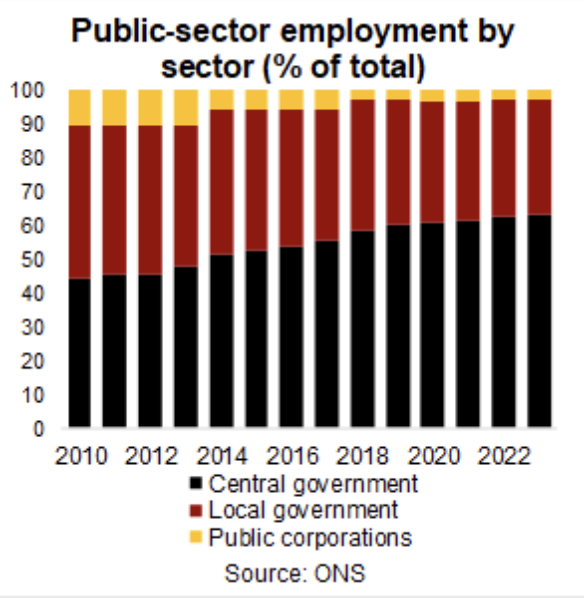
Within the public sector, central government is taking an ever larger employment share, rising from 44% in 2010 to 62% in 2023. Both local government and public corporations saw declines in their shares over that period.
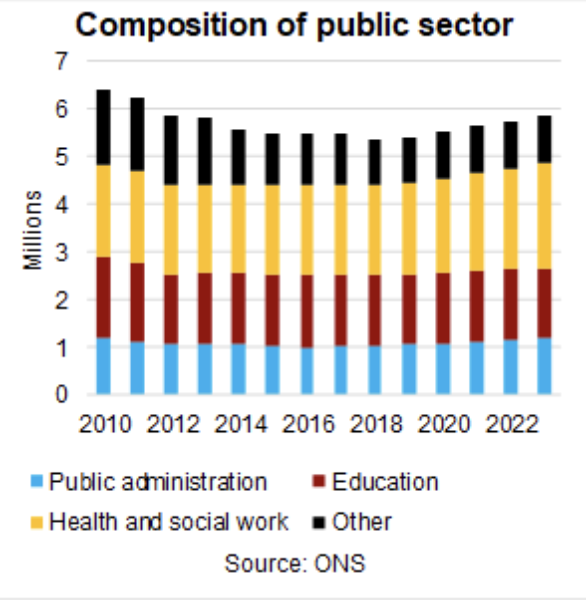
Much of this can be explained by the rapid rise in NHS employment, which went from 1.6m in 2010 to 2m in 2023. By contrast, employment in the civil service and in education remained reasonably stable over that period.
Since mid-2021 earnings have been higher in the private than in the public sector, reversing a long-term trend
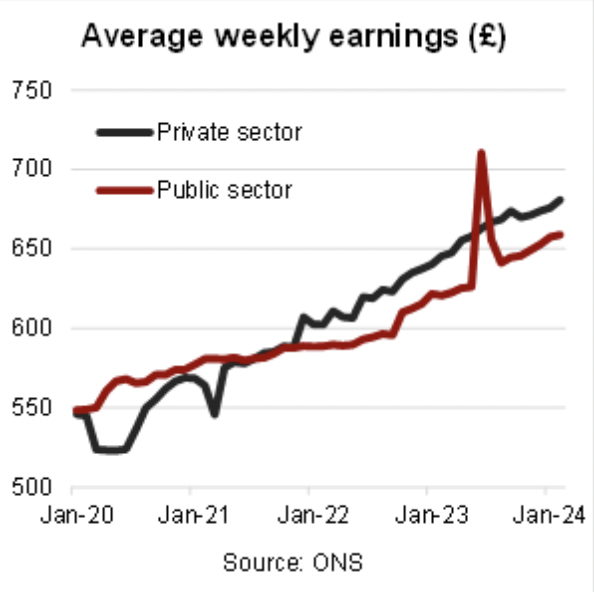
Average weekly earnings in the private sector dropped sharply at the onset of the Covid pandemic in early-2020 when many workers were moved to the government’s furlough employment support scheme. Average weekly earnings recovered quickly though and with the exception of March 2021 (when bonus pay was below trend) has seen steady growth since.
By contrast, average weekly earnings in the public sector continued to grow during the first year of the Covid pandemic but then trended sideways until early-2023. Since then it has grown more or less in line with private-sector earnings (the spike in June 2023 reflects the one-off bonus payment to NHS workers).
Notably, as a result of these diverging trends, average weekly earnings in the private sector have been higher than in the public sector since mid-2021.
This contrasts with the long-term trend. In the 290 months between January 2000 and February 2024, average weekly earnings in the private sector were higher than in the public sector in only 49 of them (16%) – 30 of which since mid-2021. The last time average weekly earnings in the private sector were higher than in the public sector over several consecutive months was in 2000.

According to the Institute of Fiscal Studies, several professions in the public sector including nurses but in particular teachers and hospital doctors have experienced much worse pay growth than the average public-sector worker. This reflects a (deliberate) compression of public-sector pay within and across professions. This contrasts with developments in the private sector over the same period. Historically average pay in the public sector has been higher than in the private sector as the average level of educational attainment and skills is higher in the former than in the latter.
Between mid-2021 and mid-2023 public-sector real wage growth was negative
With consumer price inflation accelerating from early-2021 onwards (taking annual CPIH from 0.8% in December 2020 to a peak of 9.6% in October 2022), moderate nominal average weekly earnings growth initially turned into modest real growth and then negative real growth. This was particularly notable in the public sector: in the 24 months between July 2021 and June 2023, real average weekly earnings growth was negative in 22 of them. In the private sector this was the case in 14 out of those 24 months.

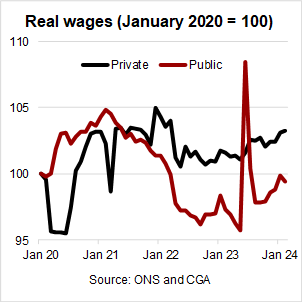
As a result (and ignoring the one-off spike in June 2023), real average weekly earnings in the public sector were well below their pre-Covid level between mid-2022 and late-2023 and are only now close to pre-pandemic levels. This contrasts with developments in the private sector, where real wages have been higher than pre-Covid since the end of the furlough period.
Why does it matter?
Public-sector pay accounts for a large part of the public-sector spending and as such plays an important role in the financial stability of local governments and other public-sector bodies. Recent earnings trends show a compression of public-sector pay within and across professions, with the result that public-sector average weekly earnings have fallen behind those in the private sector. This suggests that public-sector wages in general and for certain professions in particular face significant upward pressure, potentially straining public-sector budgets even further.
If you would like to discuss what insights and lessons you could take away from recent public-sector and private-sector employment and wage trends, please talk to us.
Suggested further reading






Key Takeaways
Capital expenditure by service
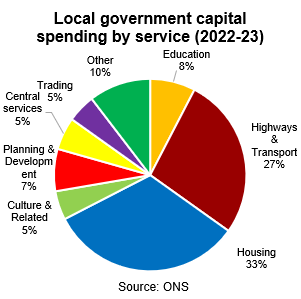
In Fiscal Year (FY) 2022-23 local authorities in England spent £27.5bn on capital expenditure. Of this spending, a third was on housing, just more than a quarter on roads and transport, and just less than a tenth on education. Planning and development services, central services, culture and related services and trading (i.e. the maintenance of civic halls, retail markets and industrial estates etc) together made up nearly a quarter, with the rest spread across services such as police, environment and fire and rescue.
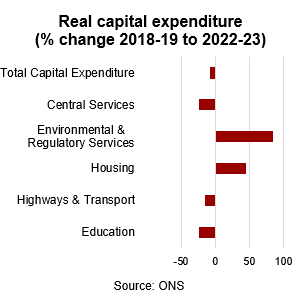
In real terms, the £27.5bn spent on capital expenditure in FY2022-23 represents a 7% decline from the 2018-19 level, with capital spending on education and central services falling by nearly a quarter. Local government capital spending on highways and transport dropped only slightly less (-15.3%). By contrast, local government capital spending on housing increased by nearly 50%, taking its share from 20% of the total in 2018-19 to a third in 2022-23.
Capital expenditure by category
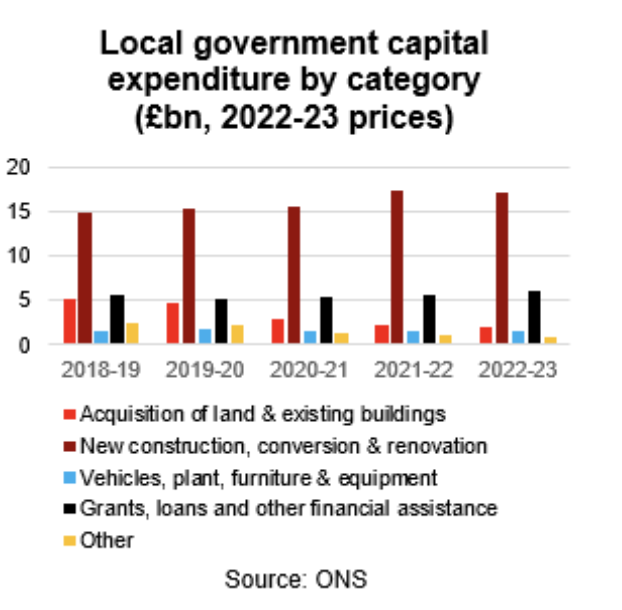
Of the £27.5bn spent in FY 2022-23, £17.2bn was spent on new construction, conversions and renovations, a further £1.9bn on the acquisition of land and existing buildings and £1.6bn on the purchase of vehicles, plant, furniture and other equipment. £6bn was given in the form of grants, loans and other financial assistance to other organisations to invest on behalf of the local authorities.
Over the period 2018-19 to 2022-23, the most notable development was the decline in investment in land and existing buildings. Amounting to £5bn in 2018-19, this more than halved over the following years, explaining the overall decline in local authority capital expenditure.
Revenue sources
The capital expenditure and revenue statistics do not fully match up, with the published expenditure data around £1.5bn lower than the revenue data.
In FY 2022-23, 40% of the resources used to finance capital expenditure came from capital grants, around 20% from revenue resources (including from the housing revenue account, major repairs reserve and CERA) and 10% from capital receipts (incl
uding money received from the selling land, buildings or other capital assets). The remainder – just under a third – was in the form of prudential borrowing. These shares remained relatively stable between 2018-19 and 2022-23.

Local authority net capital stock
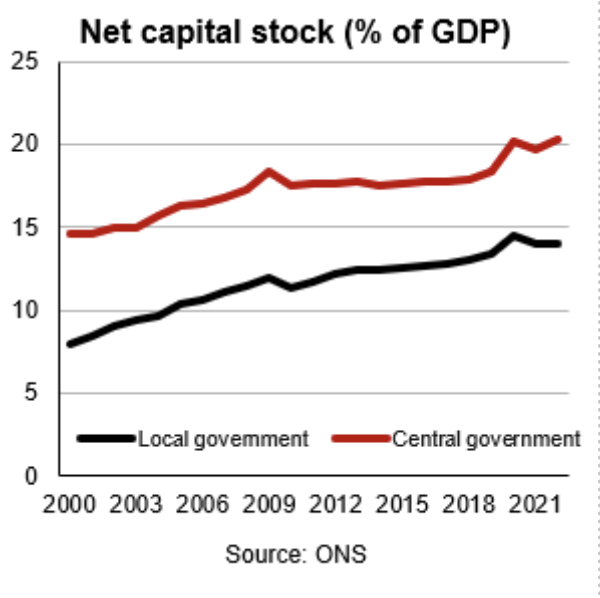
The Office for National Statistics publishes capital stock data for the UK only. As a share of GDP, the net capital stock of local government, that is the market value of fixed assets once deprecation is taken into account, increased from 8% in 2000 to 11% in 2010 and then 14% in 2022.
This is a much more notable increase than that for central government, which increased from 15% in 2000 to 20% in 2022. Other buildings and other structures have made up around 90% of the total net capital stock for local government throughout that period. The remainder is split between land improvements, ICT and other machinery and transport.
Why does it matter?
Local authorities play an important role in providing essential public services such as housing, transportation, and education. Capital expenditure and capital stock trends help to understand how this role is changing over time. Combined with local authority revenue trends they also illustrate the financing gap to be filled by prudential borrowing.
If you would like to discuss what insights and lessons you could take away from local authority capital expenditure and revenue trends in England, please talk to us.
Suggested further reading
Key Takeaways
Public-sector borrowing and debt
The UK public finances are generally reported on the level of the public sector excluding public-sector banks. This covers central and local government, public corporations, funded public-sector pensions and the Bank of England.

Public-sector net borrowing excluding public-sector banks (PSNB ex) amounted to £119.1bn in the first three quarters of the 2023-24 financial year (FY), the fourth highest on record for that period. In the second half of the last decade PSNB ex was generally around half as high in the respective periods.
PSNB ex for the full FY 2022-23 amounted to £130.1bn, equivalent to 5.1% of GDP, marginally lower than in 2021-22 but significantly smaller than the 15% recorded in 2020-21 as a result of the Covid pandemic. The share is also lower than in any FY between 2008-09 and 2013-14.
Central government is historically responsible for most of the public-sector net borrowing. In 2022-23 central government and local government borrowed £127.8bn and £10.7bn respectively on a net basis, with non-financial public corporations and funded public-sector pensions reporting small surpluses. In previous years the Bank of England also recorded small surpluses. Transfers between the sub-sectors are netted out of the statistics.
The UK government’s preferred measure of debt is on a net basis excluding public-sector banks (PSND ex). In December 2023 PSND ex stood at 97.7% of GDP, a level last seen in the early 1960s. PSND ex increased from ~35% of GDP at the end of 2007-08 to ~85% of GDP mid last decade because of the financial crisis. It jumped to nearly 100% of GDP in 2020-21 as a result of the Covid pandemic.
International public finance comparisons are commonly made on a general government gross basis. As a share of GDP, UK gross general government debt was lower in 2022 (at 101.9%) than in France (at 111.1%), the United States (at 121.3%) but higher than in Germany (at 66.1%). The G7 average was 128%, much of it reflecting Japan’s high debt level (at 260.1% of GDP).

Fiscal plans and targets
The government announced in its 2023 Autumn Statement to reduce public-sector net borrowing from an estimated ~4.5% of GDP in 2023-24 to below 2% of GDP by 2027-28 so that net debt could start falling as a share of GDP within the next five years – one of the government’s fiscal targets. In 2023-24 social protection and health spending should make up nearly half of total managed expenditure, while debt interest payments account for around 10% – only marginally less than education spending.
Fiscal sustainability
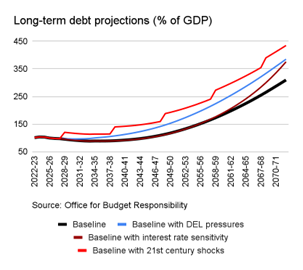
The Office for Budget Responsibility (OBR), the UK’s official independent fiscal watchdog, regularly assesses the long-term sustainability of the UK public finances. The OBR projects the PSND ex to GDP ratio to fall slightly over coming years but then to increase sharply over coming decades as a result of population ageing. In the OBR’s baseline scenario PSND ex reaches 150% of GDP by mid-century and more than 300% by the early 2070s. According to the OBR, this is probably an underestimate as many potential risks are not considered in the baseline. For example, reasonably assuming that debt interest rates rise as the government becomes more indebted could take PSND ex to around 375% of GDP by the early 2070s.
Why does it matter?
The UK public finances are a crucial part of the economic and financial environment within which local authorities operate. Fiscal pressures are on the increase at all levels of government, while raising sufficient revenue remains challenging. Local authorities will need to learn to operate within tight fiscal constraints for years to come, making it ever more important to prioritise and seek efficiency gains.
If you would like to find out more about the topics discussed in this factsheet and what these might mean for your operations, please talk to us.
Suggested further reading
2025 Autumn Budget will provide few positives for local authorities
The Chancellor, Rachel Reeves, will present the Autumn Budget on 26th November. This is an unenviable task given weak growth, geopolitical uncertainties and mounting spending pressures.
The UK government can take some comfort from the fact that other countries are facing similar fiscal challenges. Indeed, among the G7 countries the UK has the second lowest share of government debt in GDP, so shared pain might be half the pain, as the saying goes. The IMF covered this in detail only a few weeks ago: https://lnkd.in/eAYbse7B
Recent developments have offered an additional boost. Updated fiscal assessments suggest the Budget “black hole” in public finances is smaller than previously feared, prompting Rachel Reeves to signal that she will not need to raise income tax after all.
The Institute for Fiscal Studies recently looked at available tax-raising options and dismissed most on fairness, efficiency and other grounds. Raising council tax receipts beyond the already agreed 4.3% annually in future might be an option. This would benefit local authorities unless the central government decided to lower grants in return. But even this would not be without challenges: while the tax take could be boosted by raising tax rates on homes in higher value bands, these bands are still based on property prices when council tax was introduced in the early-1990s. Policymakers have not found the courage to update these bands in more than 30 years, it is unlikely they will find it now. It is no wonder that more and more organisations are arguing for fundamental tax reforms to lift growth and prosperity.
https://lnkd.in/esTcVF-J
For local authorities the autumn budget is unlikely to bring major positive surprises. In mid-October the government confirmed that it would postpone the publication of its eagerly-awaited SEND reform white paper until early-2026, however we remain hopeful that meaningful policy interventions will emerge to address the current shortcomings of the system. Local authorities are not navigating this landscape alone – Camdor Global Advisors continues to support councils with identifying sustainable strategies despite constrained budgets, help to strengthen resilience, and position themselves to take advantage of opportunities as they arise.
https://lnkd.in/eRAjM6AJ
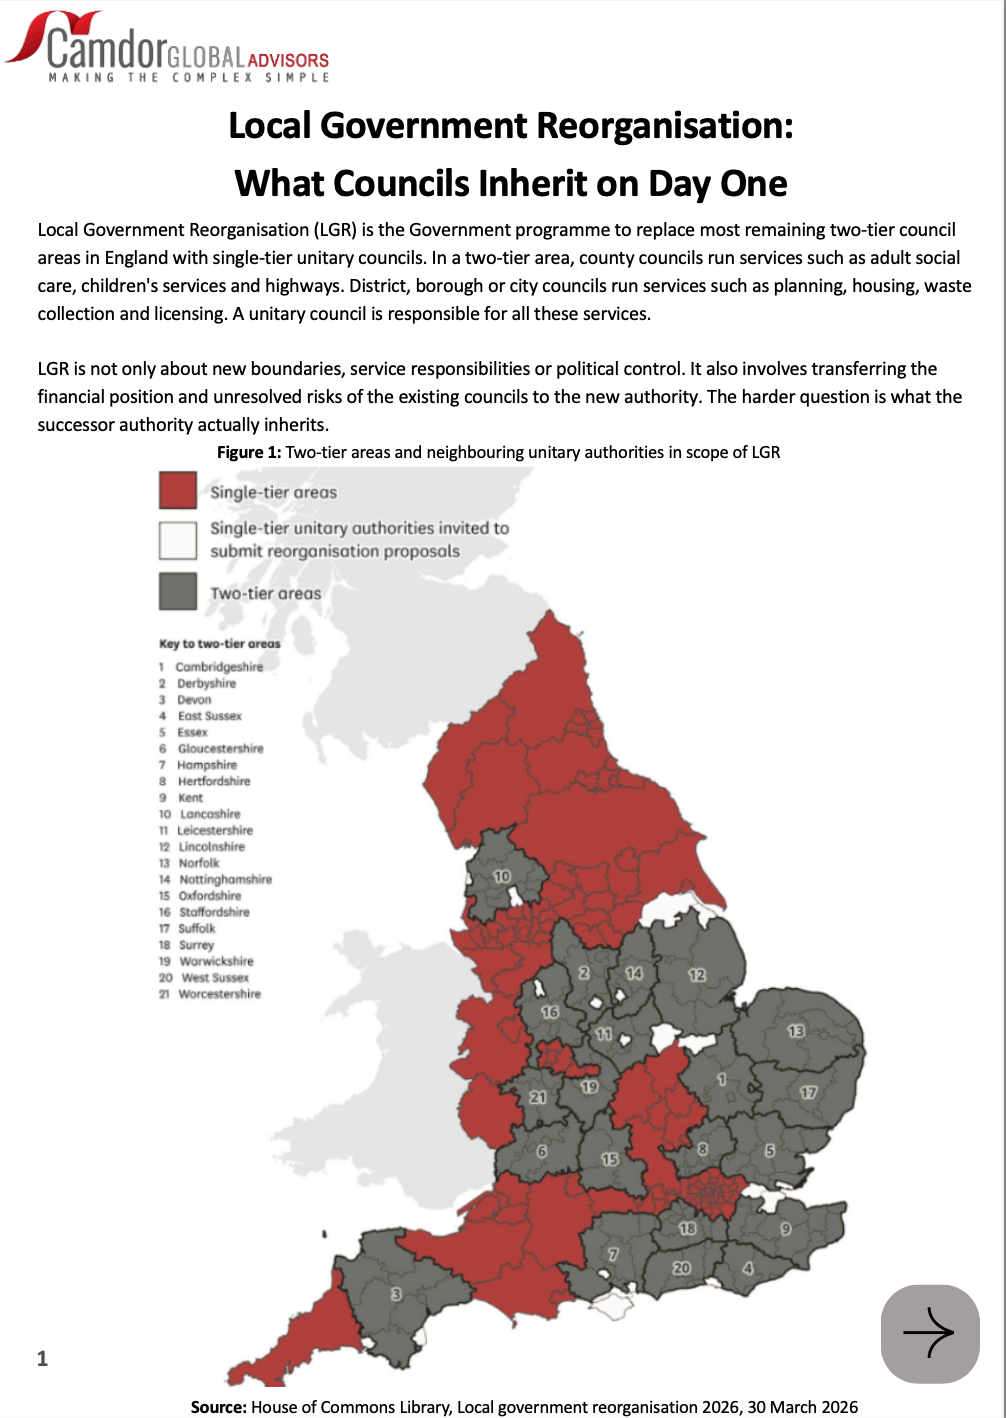
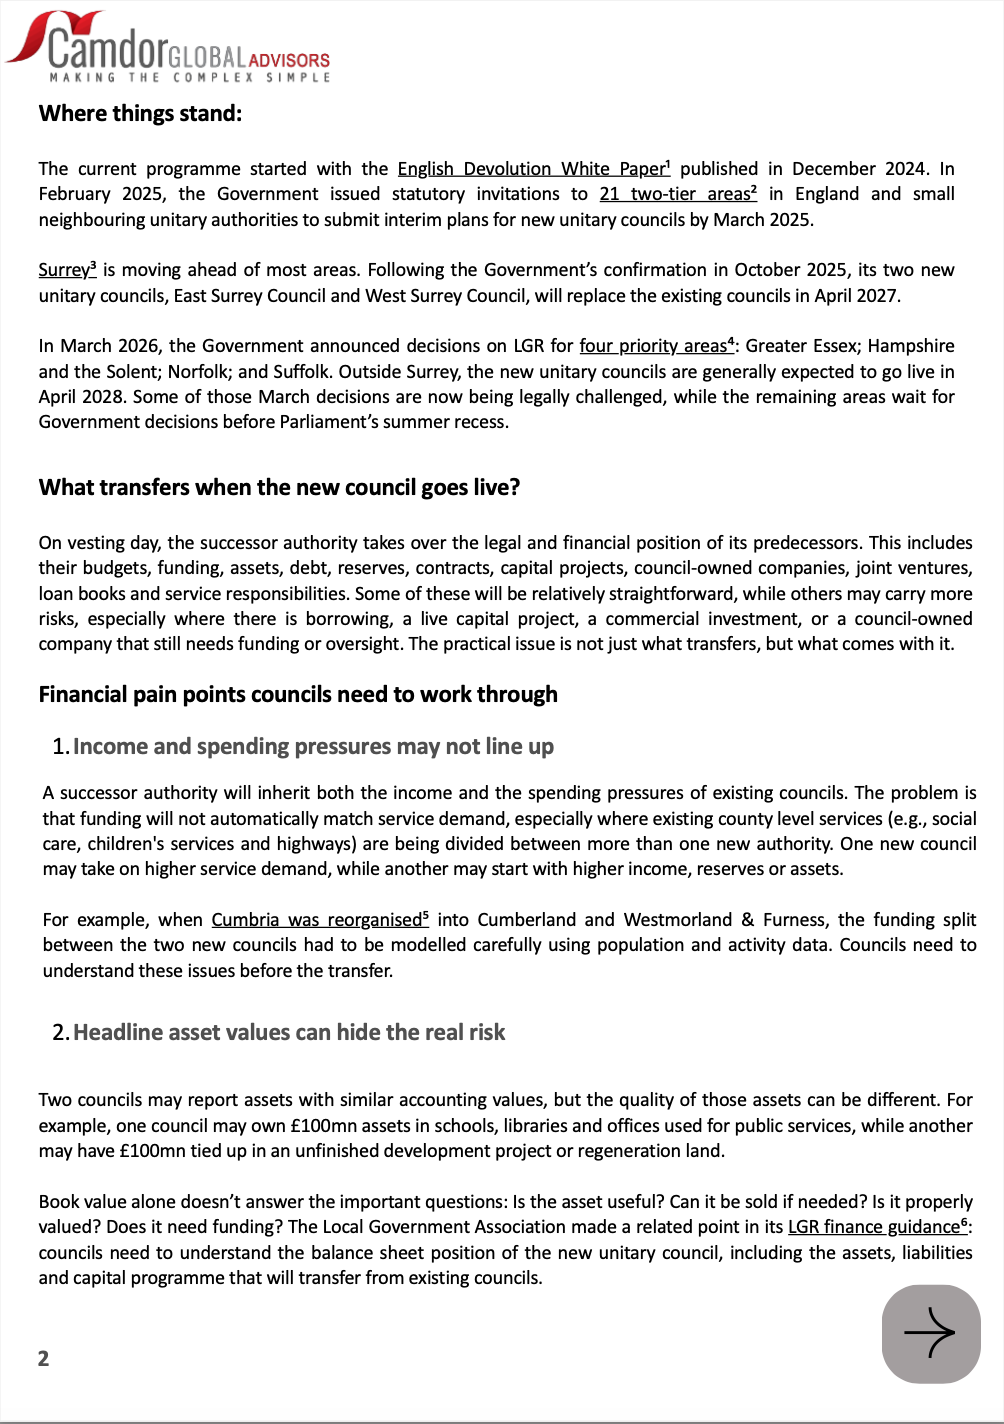
Local Government Reorganisation is often discussed in terms of boundaries and governance.
But the harder question is financial: what does the new authority actually inherit on day one?
We’ve written a short piece on the assets, debt, companies and risks that successor councils will need to understand.
Have a read down below.



Contact Camdor Global Advisors:
Bob Swarup
swarup@camdorglobaladvisors.com
Emerson Chan
emerson@camdorglobaladvisors.com

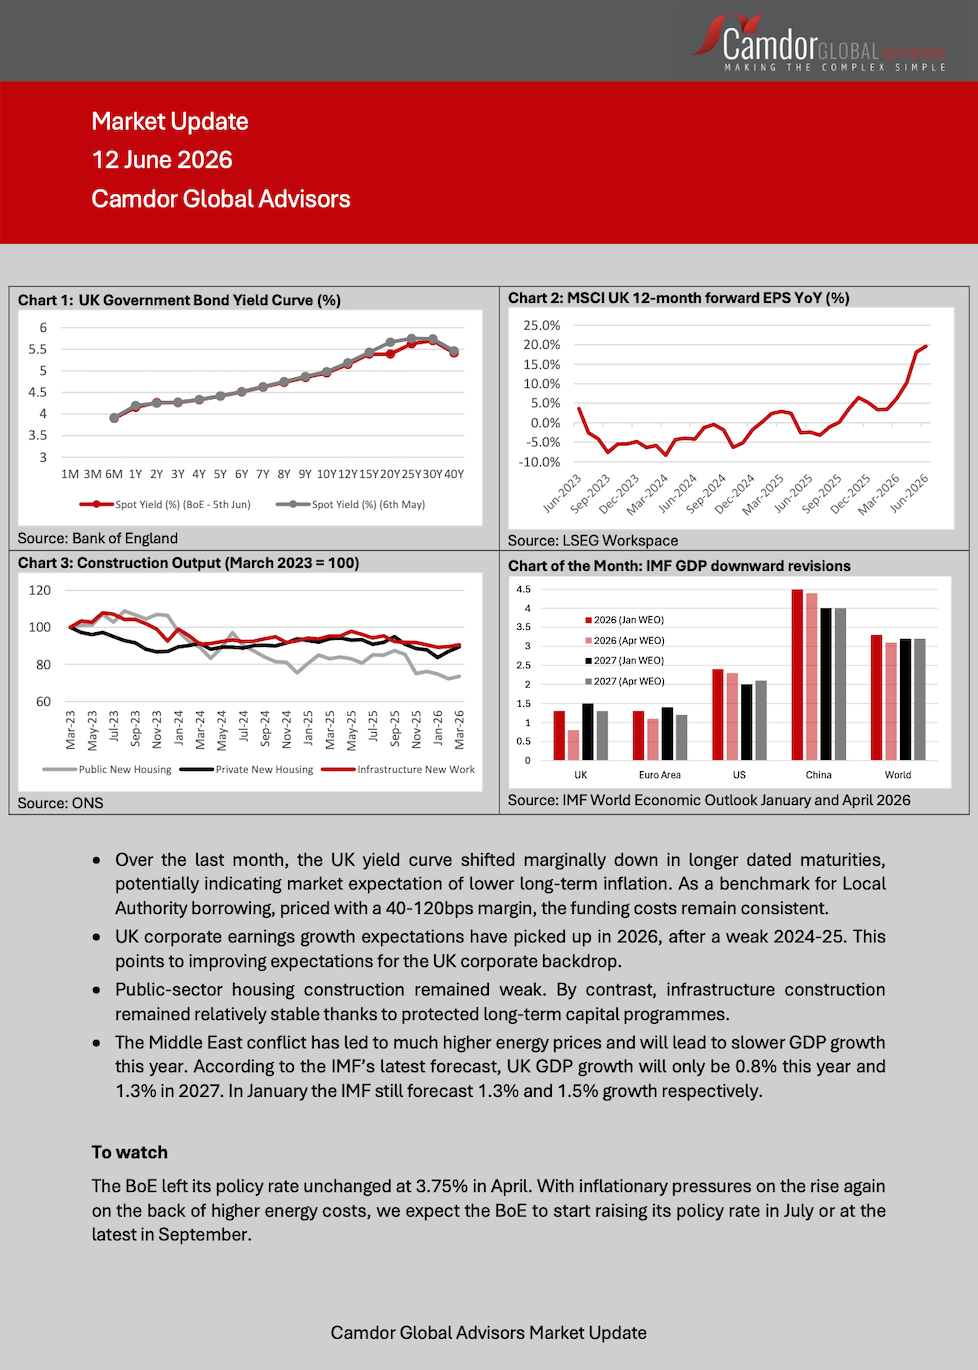
We are pleased to announce the launch of our monthly Market Update. The update provides a snapshot of key market developments relevant to Local Authorities.
The update complements our monthly Pulse, which will continue to focus on policy developments.

Contact Camdor Global Advisors:
Bob Swarup
swarup@camdorglobaladvisors.com
Emerson Chan
emerson@camdorglobaladvisors.com
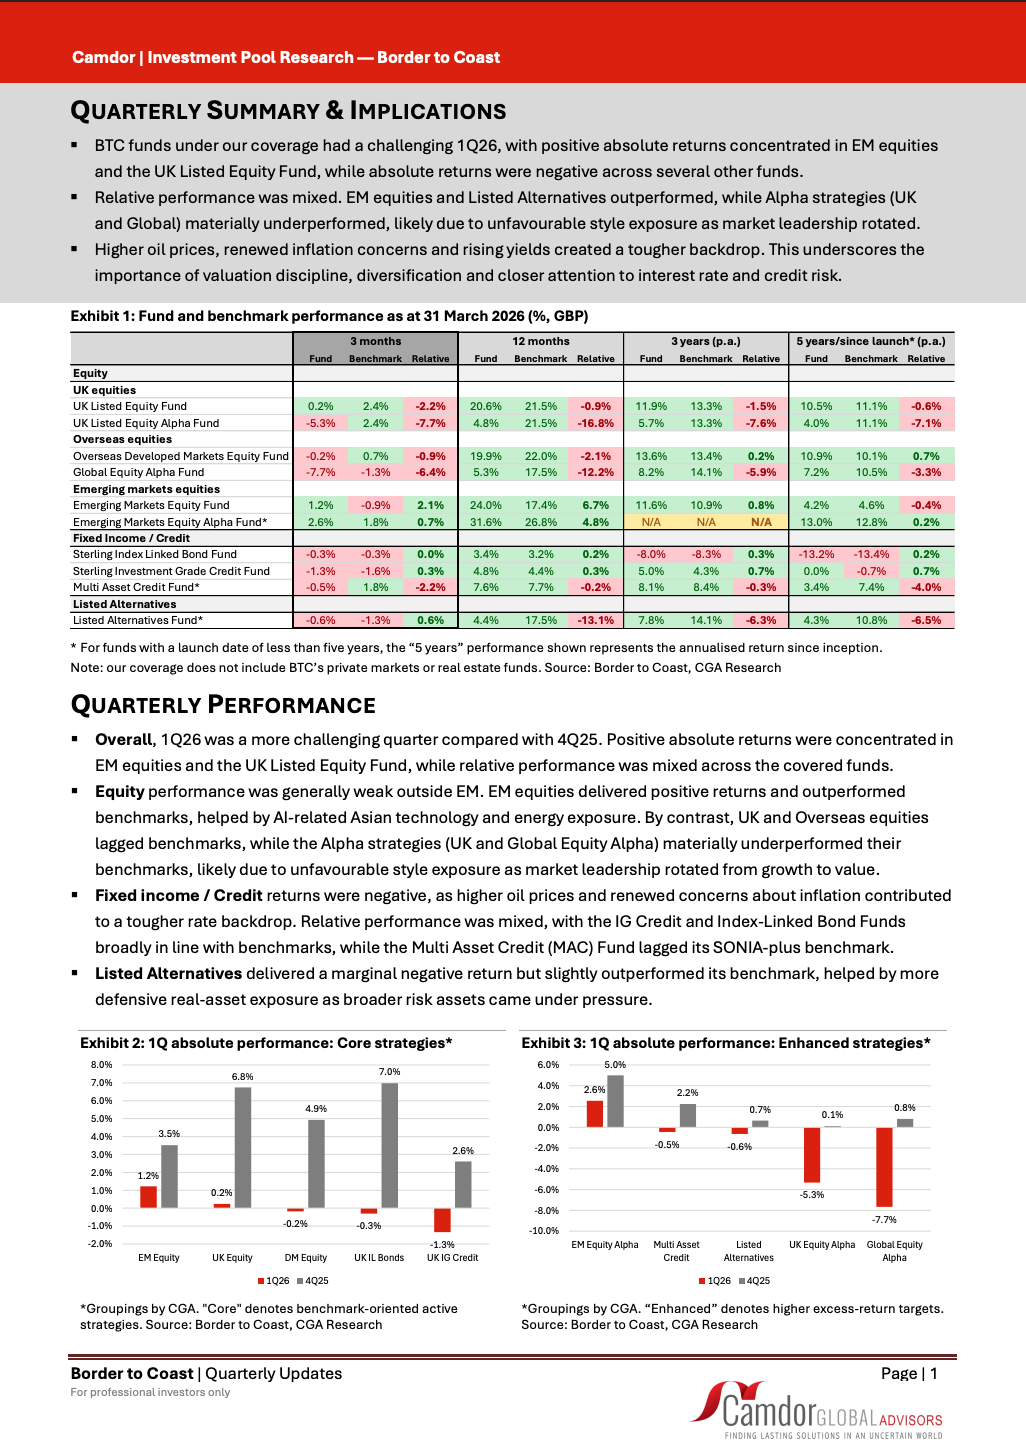
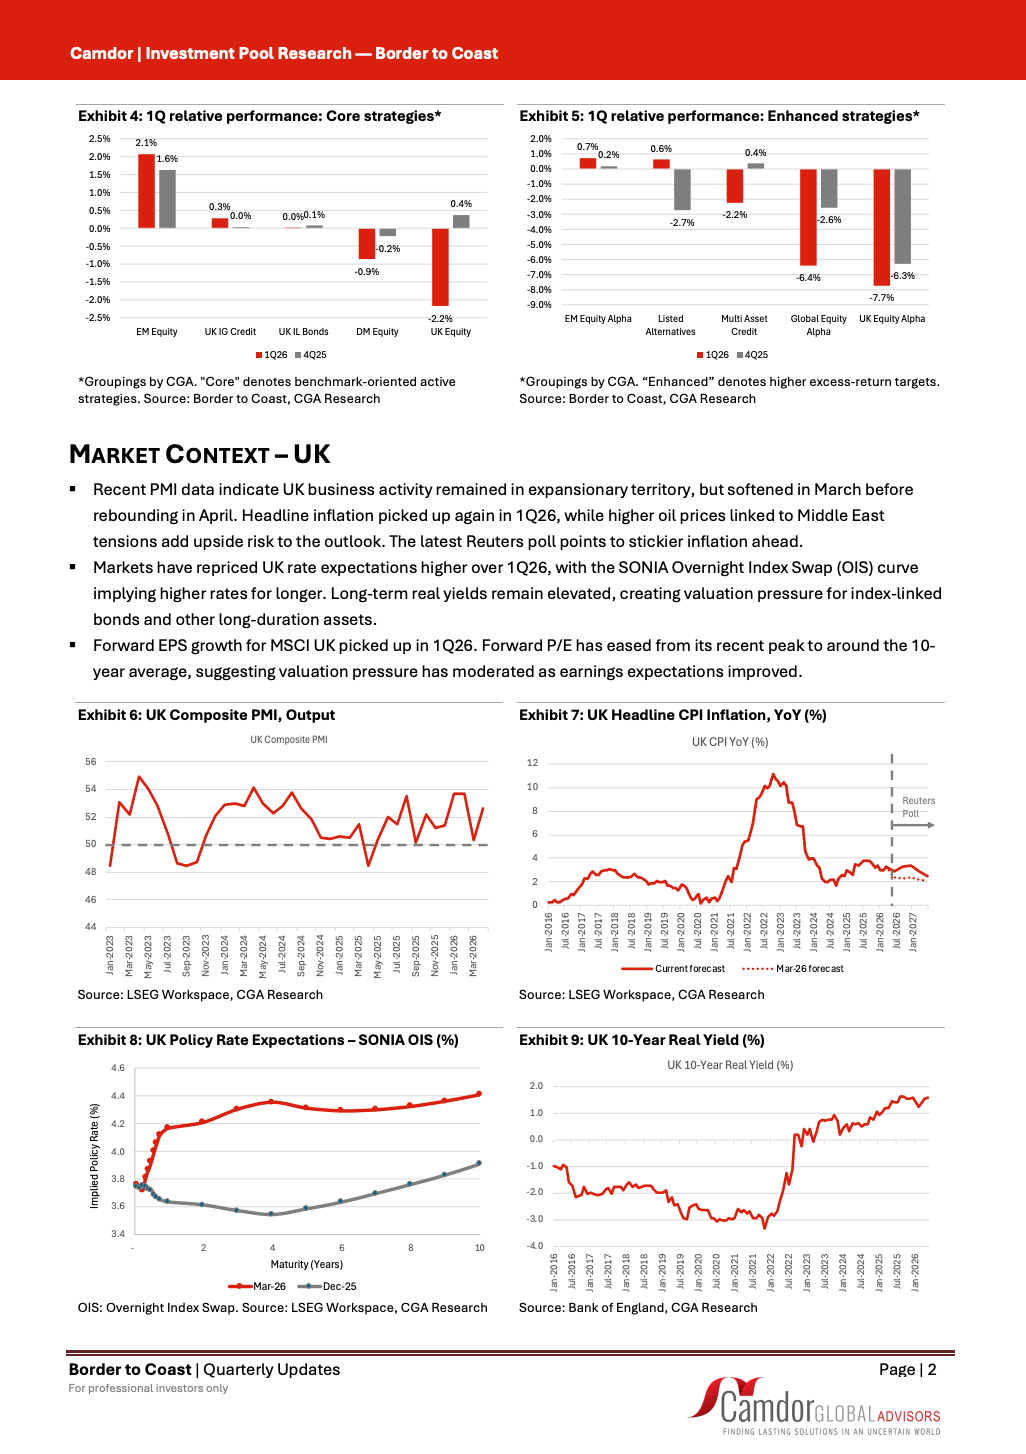
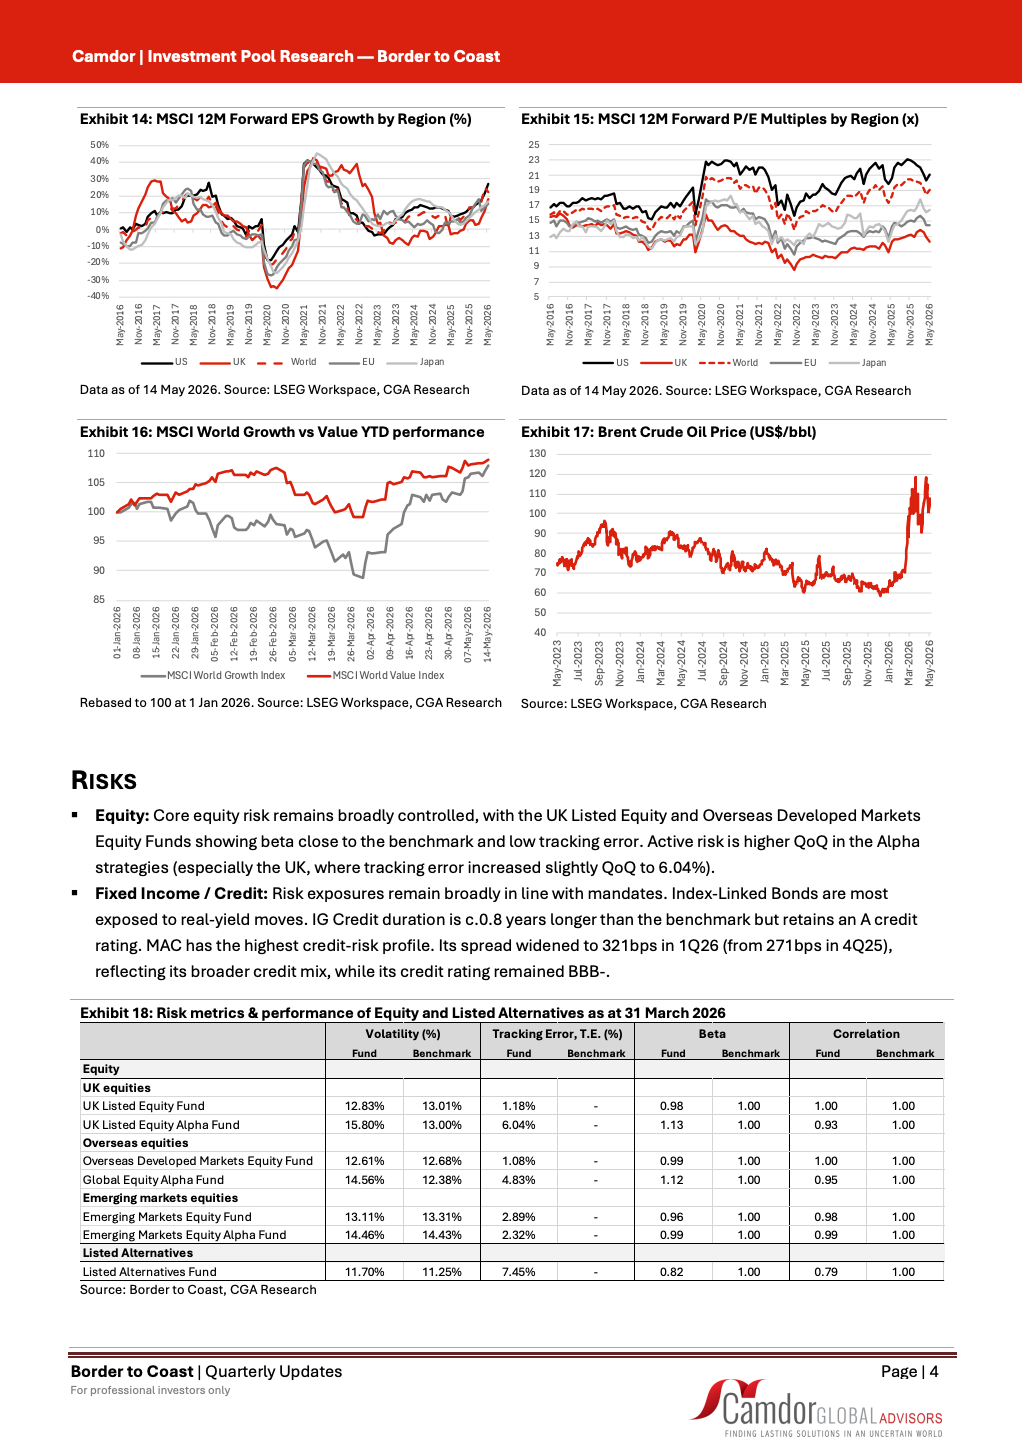
We are pleased to share our latest quarterly review of Border to Coast (BTC), covering 1Q26 fund performance, market backdrop, key risk considerations and discussion questions for LGPS fund oversight.
1Q26 was a challenging quarter, with positive absolute returns concentrated in EM equities and the UK Listed Equity Fund, while relative performance was mixed across the covered funds.
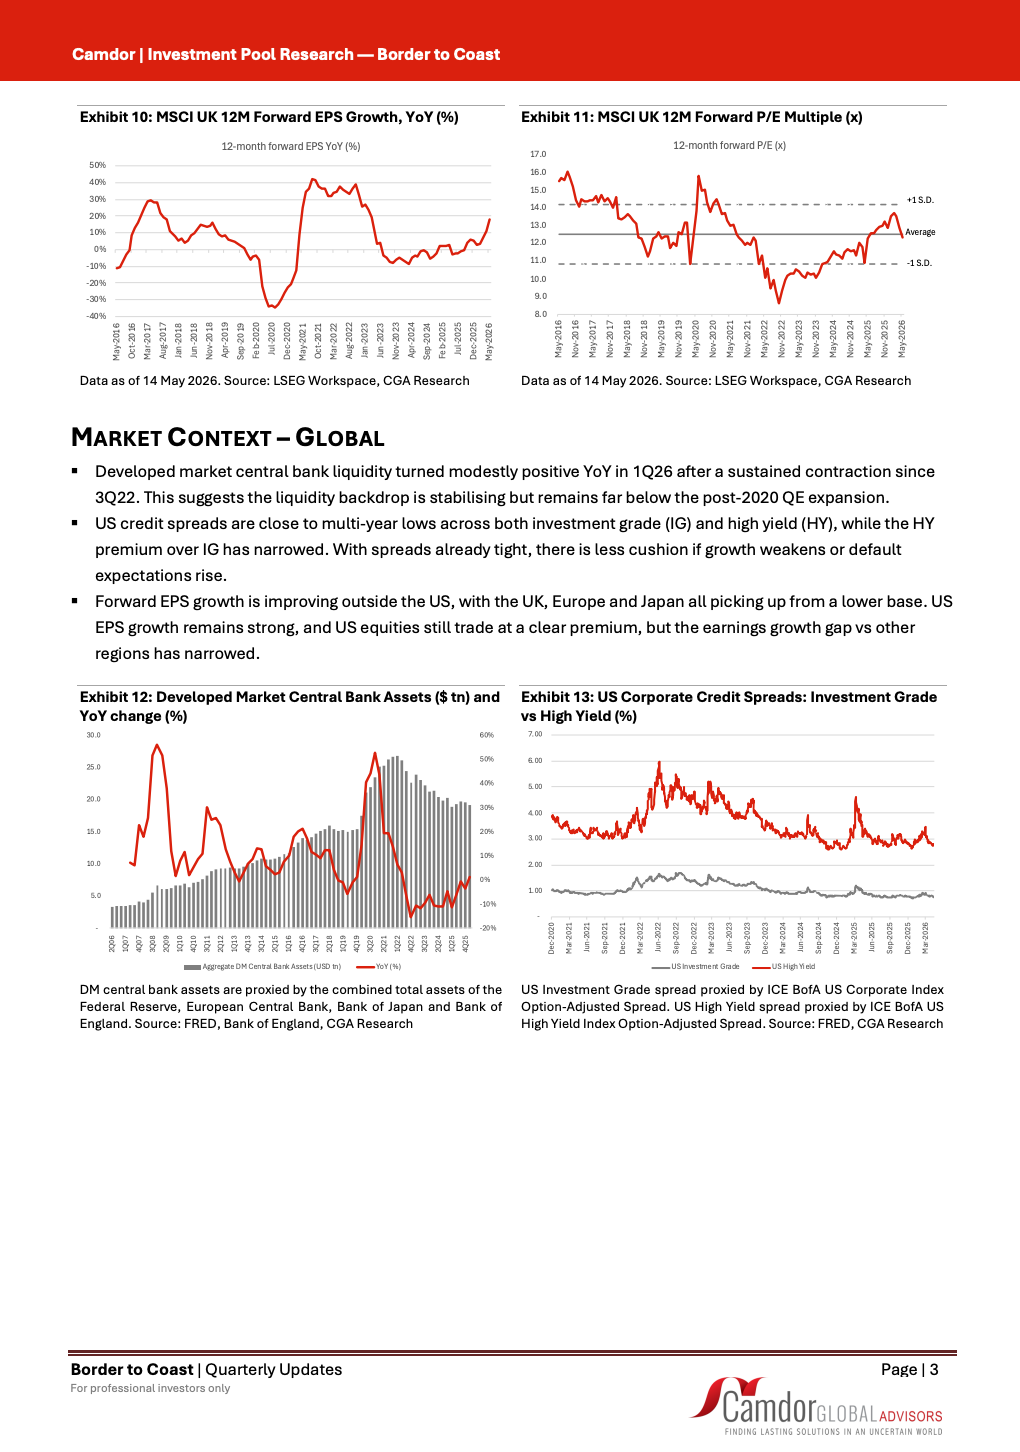
The report also discusses higher real yields, tight credit spreads and key questions around style exposure, diversification, interest-rate risk and credit risk.
For professional investors only.


Contact Camdor Global Advisors:
Emerson Chan
emerson@camdorglobaladvisors.com
Vittal Pathi
pathi@camdorglobaladvisors.com
On 21 July 2025, the UK Government made its first major announcement with the establishment of a new pensions commission that could reshape the country’s approach to retirement saving.
Amid the usual political noise from Westminster, this stands out for its potential to deliver lasting structural change and to redefine the state’s role in securing adequate incomes for future pensioners.
The new commission has been tasked with “finishing the job” started by its predecessor in the early 2000s. That earlier body recommended the introduction of workplace pensions with auto-enrolment, one of the most widely cited applications of behavioural economics in UK policymaking. This reform brought millions into pension saving, yet contribution rates remain too low to ensure adequate incomes in later life. The commission will now explore how to increase contributions and strengthen long-term sustainability.
It will also feed into a parallel review of the State Pension age, which will look at international models where pension age automatically adjusts in line with life expectancy. Bob Swarup and Frank Eich analysed similar proposals in 2009, in the wake of the first pensions commission, and their work may be worth revisiting.
The second announcement came with the publication of Sir Jon Cunliffe’s report on the future of the water sector in England and Wales. Sir Jon, a former Second Permanent Secretary to HM Treasury and Deputy Governor of the Bank of England, stresses that the supply of clean water is fundamental to the functioning of society. For this reason, it is often delivered by the public sector, as is the case in Scotland and Northern Ireland. In England and Wales, however, the sector was privatised in the 1980s, with the Government’s role confined to economic regulation via Ofwat.
Sir Jon concludes that this framework has failed to deliver and recommends a fundamental “reset” of the sector. Central to his proposals is the replacement of Ofwat with a new, more integrated regulator and supervisor. This new body would combine oversight of investment, daytoday operations, and longterm resilience.
These policy announcements come at a time when public finances are under sustained pressure. In this context, the Government is focused on two priorities. The first is to contain growth in state pension expenditure, since large increases in annual spending would add strain to the national budget. The second is to fix problems in struggling private utilities by improving regulation and management, thereby avoiding the high costs of taking them into public ownership.
However, the return of parts of the rail network to public ownership illustrates a gradual shift in the balance between public and private provision.
Whether the pensions commission and water sector reforms deliver meaningful change or remain at the level of consultation will hinge on political will and fiscal space.
For now, they are clear signals of where government priorities may be heading and will be closely watched by markets and policymakers alike.
On 21 July 2025, the UK Government made its first major announcement with the establishment of a new pensions commission that could reshape the country’s approach to retirement saving.
Amid the usual political noise from Westminster, this stands out for its potential to deliver lasting structural change and to redefine the state’s role in securing adequate incomes for future pensioners.
The new commission has been tasked with “finishing the job” started by its predecessor in the early 2000s. That earlier body recommended the introduction of workplace pensions with auto-enrolment, one of the most widely cited applications of behavioural economics in UK policymaking. This reform brought millions into pension saving, yet contribution rates remain too low to ensure adequate incomes in later life. The commission will now explore how to increase contributions and strengthen long-term sustainability.
It will also feed into a parallel review of the State Pension age, which will look at international models where pension age automatically adjusts in line with life expectancy. Bob Swarup and Frank Eich analysed similar proposals in 2009, in the wake of the first pensions commission, and their work may be worth revisiting.
The second announcement came with the publication of Sir Jon Cunliffe’s report on the future of the water sector in England and Wales. Sir Jon, a former Second Permanent Secretary to HM Treasury and Deputy Governor of the Bank of England, stresses that the supply of clean water is fundamental to the functioning of society. For this reason, it is often delivered by the public sector, as is the case in Scotland and Northern Ireland. In England and Wales, however, the sector was privatised in the 1980s, with the Government’s role confined to economic regulation via Ofwat.
Sir Jon concludes that this framework has failed to deliver and recommends a fundamental “reset” of the sector. Central to his proposals is the replacement of Ofwat with a new, more integrated regulator and supervisor. This new body would combine oversight of investment, daytoday operations, and longterm resilience.
this context, the Government is focused on two priorities. The first is to contain growth in state pension expenditure, since large increases in annual spending would add strain to the national budget. The second is to fix problems in struggling private utilities by improving regulation and management, thereby avoiding the high costs of taking them into public ownership.
These policy announcements come at a time when public finances are under sustained pressure. In this context, the Government is focused on two priorities. The first is to contain growth in state pension expenditure, since large increases in annual spending would add strain to the national budget. The second is to fix problems in struggling private utilities by improving regulation and management, thereby avoiding the high costs of taking them into public ownership.
However, the return of parts of the rail network to public ownership illustrates a gradual shift in the balance between public and private provision.
Whether the pensions commission and water sector reforms deliver meaningful change or remain at the level of consultation will hinge on political will and fiscal space.
For now, they are clear signals of where government priorities may be heading and will be closely watched by markets and policymakers alike.
The April pulse is here!
To view the latest pricing on investments and borrowings, please click here
Brief updates on the macro environment, markets and key ESG developments are below:
Global and UK Growth Outlook deteriorates due to Middle East Conflict
Cost of Living Support Measures Announced
UK Inflation Rises and BoE Rate Update Amid Conflict
Pension Schemes Bill Nears Completion Amid Parliamentary “Ping Pong” Stage
Devolution Reforms for England Continue to Progress
Clean Energy Transition Accelerates
We hope you find this update valuable.
If you have any questions for Camdor Global Advisors, please don’t hesitate to leave a comment down below, get in touch or check out our LinkedIn and website for more information.
We’re always happy to chat and assist where we can.
On 29 April the Pension Schemes Bill received Royal Assent and became law. It brings to a close a policy initiative which started in late 2024 with Chancellor Reeves’ first Mansion House speech.
According to the Government, this is a landmark bill, which will help more than 20 million people better save for their retirement and will boost UK growth. It aims to achieve that by reducing costs and boosting returns. It will also make it easier to consolidate smaller individual pension pots and allow the creation of multi-employer defined-contribution ‘megafunds’. Importantly, after much back and forth with the House of Lords, the Government agreed to tone down its original plans. These would have given it the power to mandate UK pension schemes to invest in private markets, half of this investment being in the UK.
It is good to see these proposed powers watered down. While we can see why the Government might want to steer pension investment to what it might consider to be “good causes”, it really should be for the schemes themselves to decide what is best for their members.
The Bill also put the finishing touches to the consolidation of the Local Government Pension Scheme into a few pools, which the government hopes will lead to economies of scale and generally better outcomes. This consolidation is nearly complete now, with pools already doing most of what they are expected to do. But as local authorities move from trusted and established arrangements involving appointed fund managers and independent advisors to new arrangements centred around powerful pools, they need to remain extra vigilant. Governance issues may emerge as the relationships between stakeholders change.