Factsheet: Public-sector Employment and Wage Trends
Key Takeaways
The share of public-sector employment in total employment has been relatively stable once reclassification effects are taken into account. In 2023 around 17% of the total workforce worked in the public sector. With NHS employment rising, the share of central government employment in public-sector employment is on the increase.
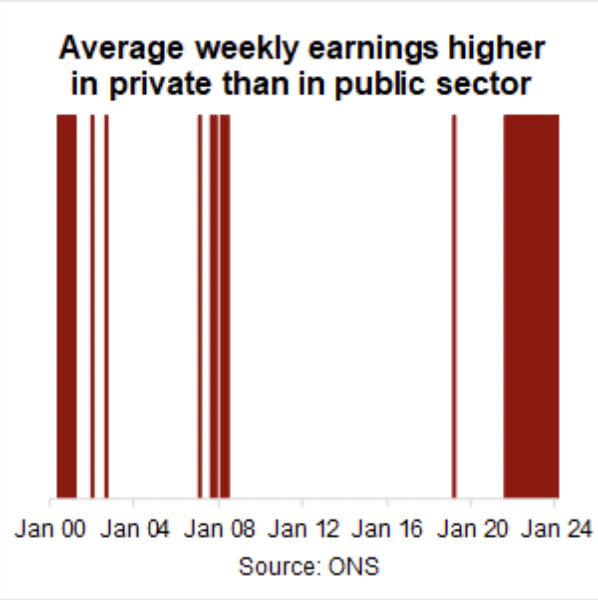
Since mid-2021 average weekly earnings have been higher in the private than in the public sector. Since the beginning of the century this has only otherwise been the case in 2000. Moreover, there has been a compression of pay within the public sector. Historically average weekly earnings have been higher in the public than in the private sector as educational attainment and skills are generally higher in the former.
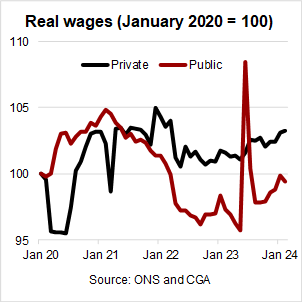
Between mid-2021 and mid-2023 public-sector real wage growth was negative, with the result that real average weekly earnings have still not returned to pre-Covid levels. By contrast, real average weekly earnings in the private sector have been higher than pre-Covid with the exception of the furlough period in 2020.
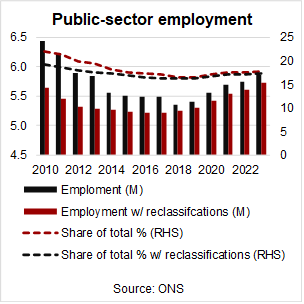
The share of public-sector employment in total employment has been relatively stable once reclassification effects are taken into account
The share of public-sector employment in total UK employment dropped from 22% in 2010 to around 16.5% in 2018 and has since only gradually increased again. In absolute numbers public-sector employment was – at 5.9m – around 560,000 lower in 2023 than in 2010.
However, these headline changes reflect more sectoral reclassifications than actual trends. Among other reclassification changes, Further Education and Sixth Form College corporations in England were included in the public sector before mid-20212 but have been included in the private sector since then. Going the other way, Lloyds Banking Group plc and Royal Mail plc were reclassified from the public to the private sector at the end 2013. Once these reclassification changes are taken into account, the drop in the share of public-sector employment in total employment was much more modest and public-sector employment was in fact marginally higher in absolute terms in 2023 than in 2012.
The share of public-sector employment in total employment varies considerably across the regions of the UK. In 2023, in the East and South East only 15% of the total workforce was employed in the public sector. This contrasts with 26% in Northern Ireland.
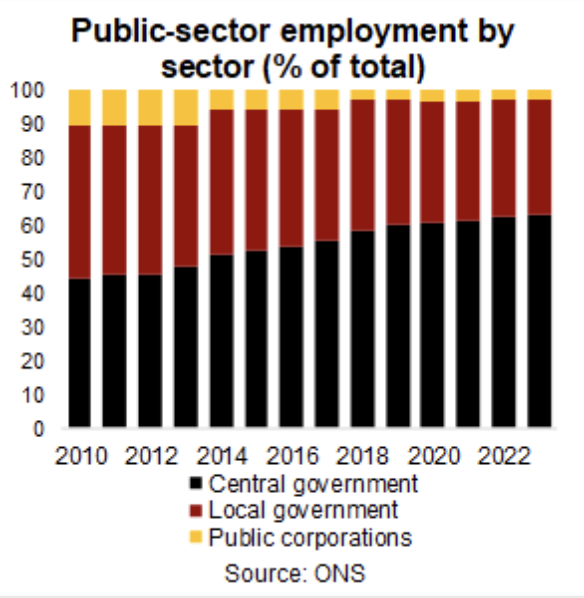
Within the public sector, central government is taking an ever larger employment share, rising from 44% in 2010 to 62% in 2023. Both local government and public corporations saw declines in their shares over that period.
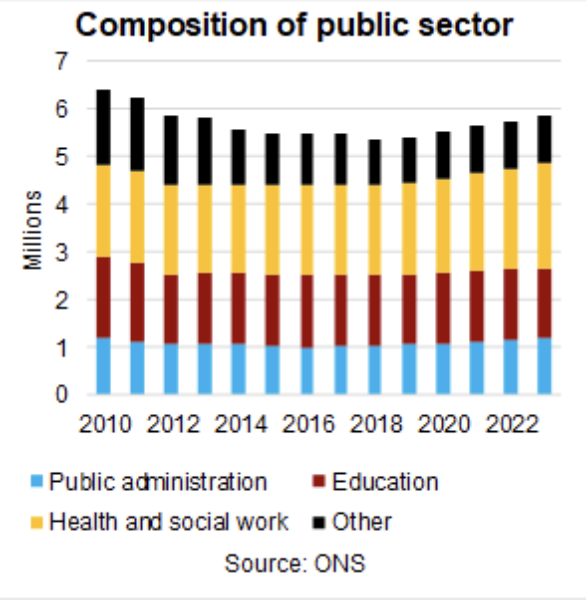
Much of this can be explained by the rapid rise in NHS employment, which went from 1.6m in 2010 to 2m in 2023. By contrast, employment in the civil service and in education remained reasonably stable over that period.
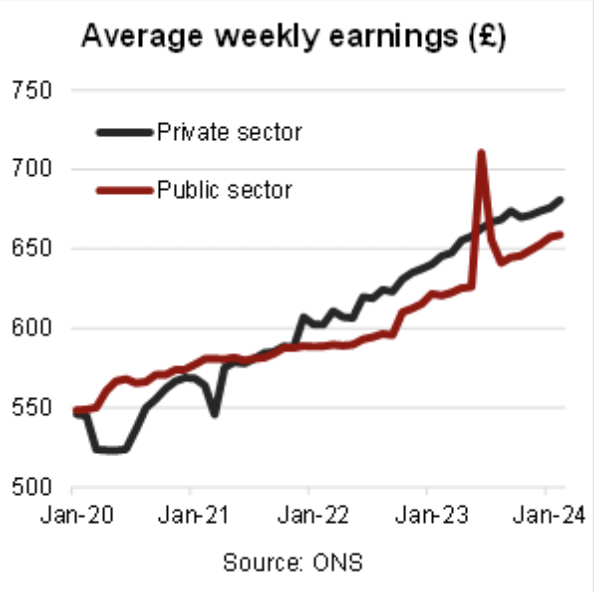
Since mid-2021 earnings have been higher in the private than in the public sector, reversing a long-term trend
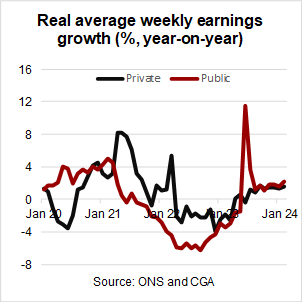
Average weekly earnings in the private sector dropped sharply at the onset of the Covid pandemic in early-2020 when many workers were moved to the government’s furlough employment support scheme. Average weekly earnings recovered quickly though and with the exception of March 2021 (when bonus pay was below trend) has seen steady growth since.
By contrast, average weekly earnings in the public sector continued to grow during the first year of the Covid pandemic but then trended sideways until early-2023. Since then it has grown more or less in line with private-sector earnings (the spike in June 2023 reflects the one-off bonus payment to NHS workers).
Notably, as a result of these diverging trends, average weekly earnings in the private sector have been higher than in the public sector since mid-2021.
This contrasts with the long-term trend. In the 290 months between January 2000 and February 2024, average weekly earnings in the private sector were higher than in the public sector in only 49 of them (16%) – 30 of which since mid-2021. The last time average weekly earnings in the private sector were higher than in the public sector over several consecutive months was in 2000.
According to the Institute of Fiscal Studies, several professions in the public sector including nurses but in particular teachers and hospital doctors have experienced much worse pay growth than the average public-sector worker. This reflects a (deliberate) compression of public-sector pay within and across professions. This contrasts with developments in the private sector over the same period. Historically average pay in the public sector has been higher than in the private sector as the average level of educational attainment and skills is higher in the former than in the latter.
Between mid-2021 and mid-2023 public-sector real wage growth was negative
With consumer price inflation accelerating from early-2021 onwards (taking annual CPIH from 0.8% in December 2020 to a peak of 9.6% in October 2022), moderate nominal average weekly earnings growth initially turned into modest real growth and then negative real growth. This was particularly notable in the public sector: in the 24 months between July 2021 and June 2023, real average weekly earnings growth was negative in 22 of them. In the private sector this was the case in 14 out of those 24 months.
As a result (and ignoring the one-off spike in June 2023), real average weekly earnings in the public sector were well below their pre-Covid level between mid-2022 and late-2023 and are only now close to pre-pandemic levels. This contrasts with developments in the private sector, where real wages have been higher than pre-Covid since the end of the furlough period.
Why does it matter?
Public-sector pay accounts for a large part of the public-sector spending and as such plays an important role in the financial stability of local governments and other public-sector bodies. Recent earnings trends show a compression of public-sector pay within and across professions, with the result that public-sector average weekly earnings have fallen behind those in the private sector. This suggests that public-sector wages in general and for certain professions in particular face significant upward pressure, potentially straining public-sector budgets even further.
If you would like to discuss what insights and lessons you could take away from recent public-sector and private-sector employment and wage trends, please talk to us.
In 2022-23 public-sector net borrowing excl. public-sector banks amounted to 5.1% of GDP. Central government is responsible for the overwhelming share of public-sector net borrowing.
In 2022-23 public-sector net debt was close to 100% of GDP – about average for an advanced…
The population of England is growing and ageing rapidly. The South West has by far the oldest population, London the youngest.
The total fertility rate varies widely across local authority districts and is not high enough to replace the population. Similarly, age-standardised…
In 2022-23 English local authorities spent a third of their capital expenditure on housing and about a quarter on highways and transport. In 2022-23 capital expenditure, which was down by 7% in real terms on 2018-19, was mainly used for new…
Rapid increase in the number of corporate reporting standards and requirements aimed at raising transparency and accountability and ultimately improving corporate performance.
Reporting requirements cover, among other things, climate- and nature-related financial disclosures, environmental and social sustainability along the value chain, strategy…
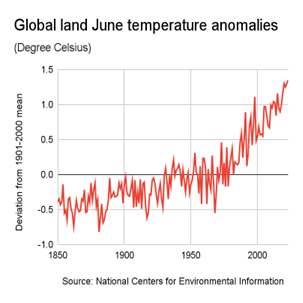
Average earth surface temperature is now ~1.1°C higher than before the industrial revolution. Ocean surface temperature also increased significantly. There is clear scientific evidence that recent climate change is man made.
Climate change manifests itself in rising temperatures and changing weather patterns….
Average earth surface temperature is now ~1.1°C higher than before the industrial revolution. Ocean surface temperature also increased significantly. There is clear scientific evidence that recent climate change is man made.
Climate change manifests itself in rising temperatures and changing weather patterns. Climate change can also explain recent increases in temperatures in the UK.
Globally, climate change has affected biodiversity, water supply, flooding and wildfires, crop failures and food security. In UK temperature-related excess mortality has so far fallen.
What is climate change?
Climate change refers to long-term changes in temperatures (i.e. global warming) and weather patterns. The earth’s climate has changed throughout history, so the phenomenon is not new. What is new is the speed and magnitude of change recorded over recent decades.
According to the United Nations (UN), the average temperature of the earth’s surface is now ~1.1°C higher than it was before the industrial revolution and the highest in the last 100,000 years. The decade between 2011 and 2020 was the warmest on record, and each of the last four decades has been warmer than any previous decade since 1850. Moreover, July 2023 was by far the hottest July on record and likely the hottest it has been in 120,000 years.
According to the UN, there is overwhelming scientific evidence that climate change over the last two centuries is man made.
How does it manifest itself?
Beyond an increasing average temperature of the earth’s surface, climate change manifests itself in many other ways. For example, over the last four decades the global mean sea surface temperature has increased by ~0.6°C – according to NASA, around 9/10th of global warming is occurring in the oceans. Increasing ocean temperatures have been linked to increasing hurricane intensity, while rising temperature levels generally have accelerated the melting of polar ice caps, resulting in rising sea levels (these have risen by more than 20 cm since 1880), and of glaciers in the mountain ranges of the world.
Changing weather patterns are also reflected in changing global patterns of precipitation, for example in less frequent but more intense rainfall, and wind patterns, both in terms of direction and speed. The impact of climate change will vary across regions or even local areas.
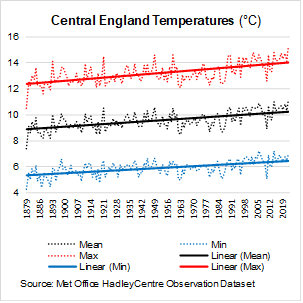
According to the Met Office climate change can also explain the rise in more intense and frequent warm spells and fall in more intense and frequent cold spells in the UK. Central England temperatures have risen markedly since records began in the 1880s. The linkage to heavy rains, dry spells and storms remains inconclusive though.
What are the consequences globally?
Consequences include:
rising land temperatures which affect biodiversity and wildlife and raise risk of wildfires (e.g. Australia 2019/20, USA 2020, Canada 2023), potentially hitting human settlements
rising sea levels which raise the risk of coastal flooding, potentially hitting human settlements
lack of new snow fall and melting glaciers which raise risk of water shortages, for example in the Americas (e.g. Maipo river basin in the Andes, Colorado river basin in the Rocky Mountains) and in South Asia (e.g. Indus river basin in the Himalaya)
extended and less predictable dry spells which raise risk of droughts, crop failures and food insecurity, potentially making regions uninhabitable and triggering international migration
more intense rain falls which raise risk of river flooding, potentially hitting human settlements
rising sea temperatures which affect biodiversity and sealife. More frequent and strong hurricanes, cyclones and typhoons could hit human settlements
excess mortality as a result of more frequent and extreme heatwaves.
What are the consequences in the UK?
According to the UK Government Actuary’s Department, the net effect of temperature change on excess mortality – that is the number of deaths above what would be expected under ‘normal’ conditions – so far has been negative, with lower excess deaths as a result of milder winters more than offsetting higher excess deaths as a result of hotter summers.
Why does it matter?
Climate change is one of the biggest challenges facing societies in the UK and elsewhere. Climate change has been rapid over recent decades and is, if anything, expected to accelerate in the decades ahead, with potentially significant adverse consequences for the UK. Local councils need to prepare for these inevitable changes and will need to make their contribution to slow down climate change.
If you would like to find out more about the topics discussed in this factsheet and how we might be able to help you with ESG reporting, please talk to us.
In 2022-23 public-sector net borrowing excl. public-sector banks amounted to 5.1% of GDP. Central government is responsible for the overwhelming share of public-sector net borrowing.
In 2022-23 public-sector net debt was close to 100% of GDP – about average for an advanced…
The population of England is growing and ageing rapidly. The South West has by far the oldest population, London the youngest.
The total fertility rate varies widely across local authority districts and is not high enough to replace the population. Similarly, age-standardised…
In 2022-23 English local authorities spent a third of their capital expenditure on housing and about a quarter on highways and transport. In 2022-23 capital expenditure, which was down by 7% in real terms on 2018-19, was mainly used for new…
The share of public-sector employment in total employment has been relatively stable once reclassification effects are taken into account. In 2023 around 17% of the total workforce worked in the public sector. With NHS employment rising, the share of central government…
Rapid increase in the number of corporate reporting standards and requirements aimed at raising transparency and accountability and ultimately improving corporate performance.
Reporting requirements cover, among other things, climate- and nature-related financial disclosures, environmental and social sustainability along the value chain, strategy…
Stay connected and never miss out on exclusive updates and breaking news. Join our mailing list today for a world of benefits delivered right to your inbox. Sign up now and be a part of our thriving community.